The iPhone Halo Effect
All code for this project can be viewed here: link
Apple, Inc ("AAPL") is best known as the creator of the iPhone, which as of most recent quarter accounted for 60% of the company's revenue and 40% of its profit. AAPL regularly reports metrics related to iPhone sales as part of its quarterly earnings reports - and for this reason, equity analysts regularly publish estimates for metrics related to iPhone units, unit growth, pricing trends, etc. These analyst estimates are then embedded in market expectations for investors. The near-annual cadence of iPhone product releases, and the importance of the stock - it is the largest company in the world, with a $2.5 trillion market cap - presents an opportunity to detect potentially profitable patterns in the trading of AAPL stock leading up to and after the release of a flagship iPhone product.
Hypothesis:
Buying AAPL stock 90 days before the launch of a flagship iPhone product delivers uncorrelated alpha as the market factors in rising expectations about a new product cycle; corollary: selling AAPL stock the day the iPhone goes on sale minimizes adverse outcomes from execution issues or results falling short of elevated expectations.
Outcome:
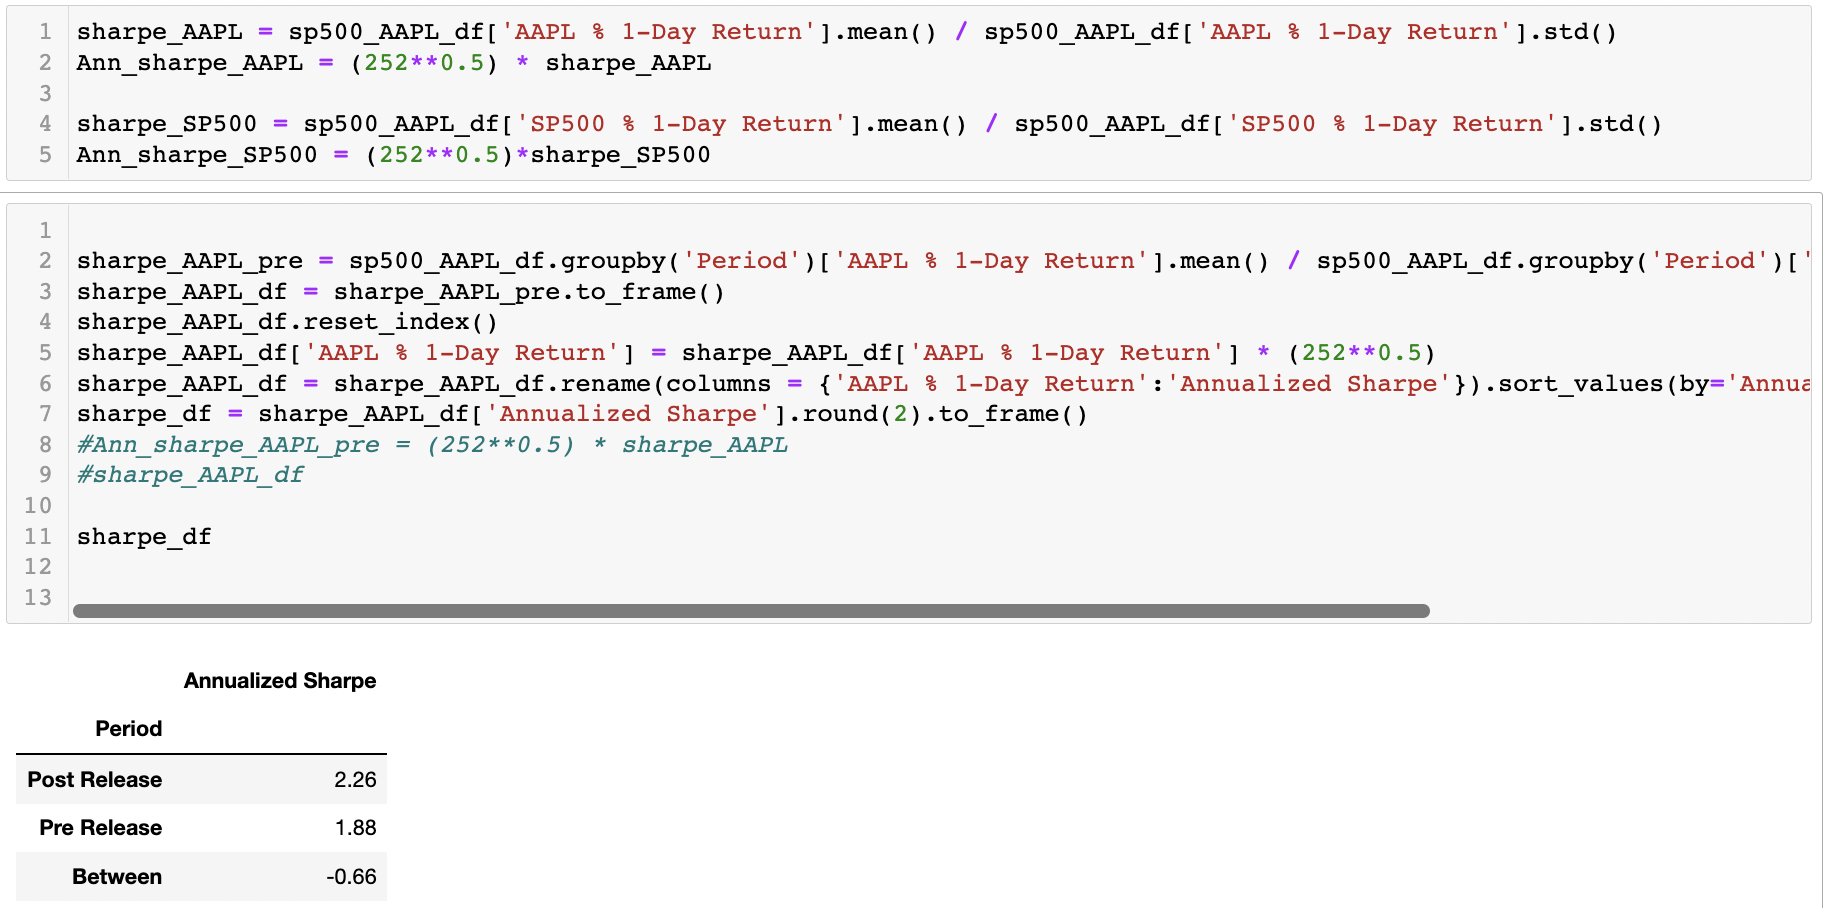
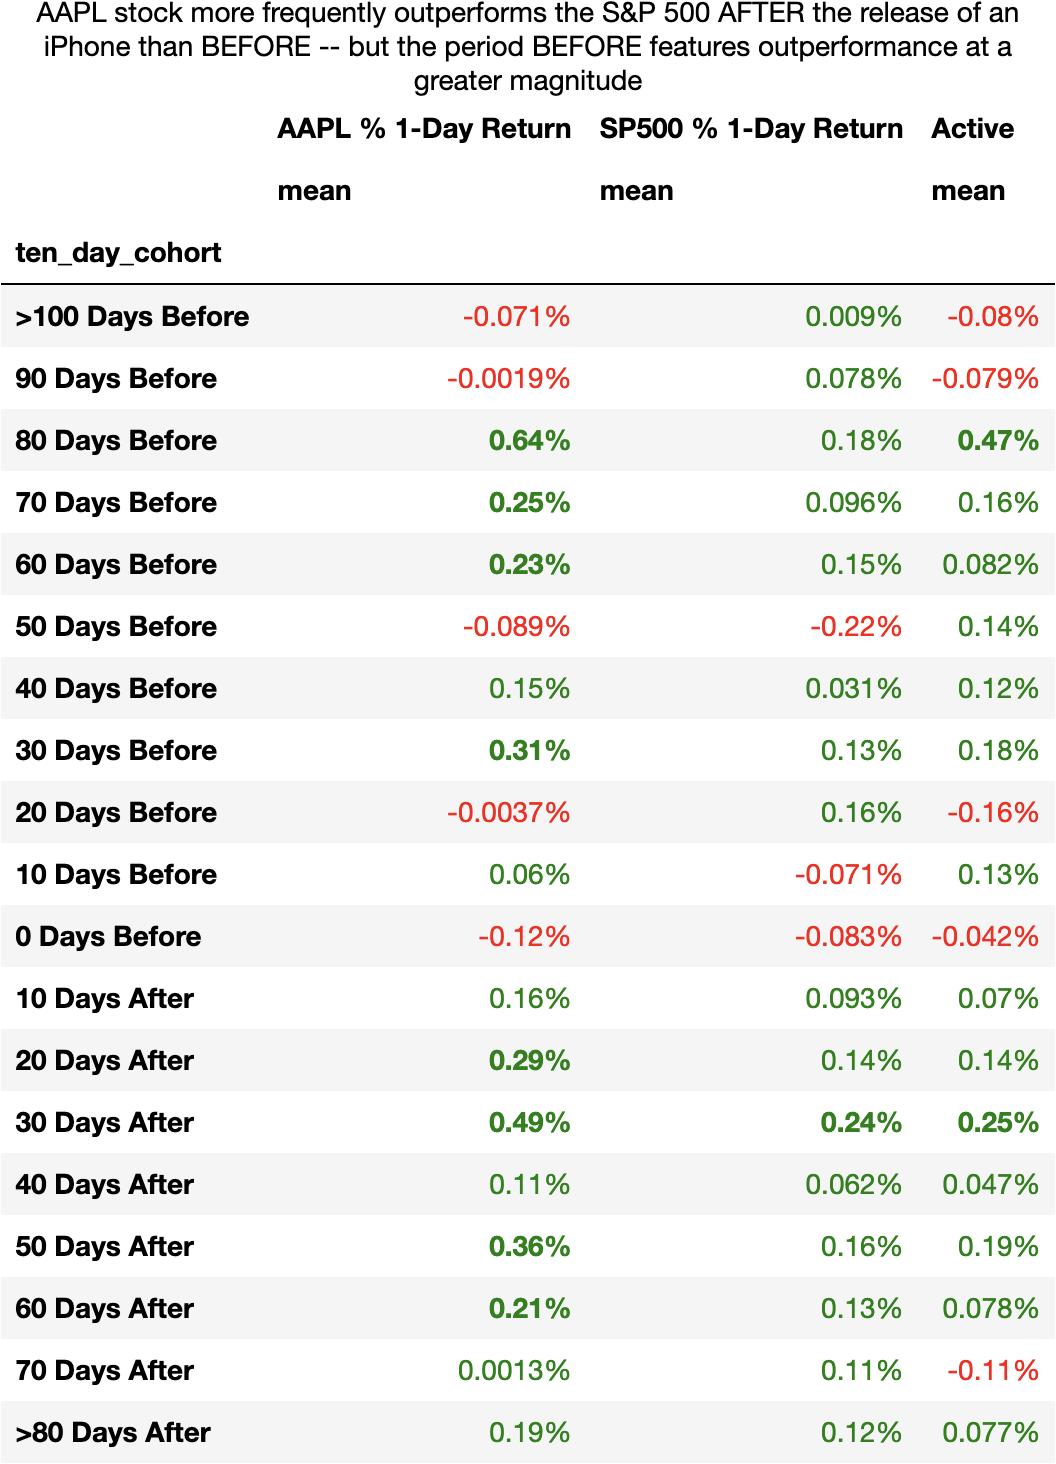
AAPL stock actually tends to outperform in the days after an iPhone launch, as compared to the days leading up to a new product cycle. Overall the stock tends to perform well in both periods. That said, when looking at the average of 10-day trading cohorts in the days leading up to and after the release of an iPhone, shares of AAPL on average outperformed the S&P 500 (a proxy for the broader market) in 7 out of 8 10-day cohorts AFTER the product release. This compares to AAPL stock outperforming the S&P 500 in 7 out of 11 10-day trading cohorts, on average, in the days BEFORE an iPhone release. It's possible that AAPL stock benefits from a perceived 'Halo' effect after the product launches, during which positive experience related to the iPhone created a positive view of other AAPL products and the stock price. All in, buying AAPL stock 90 days before the release of a flagship iPhone generated returns with an annualized Sharpe ratio of 1.88 while buying AAPL stock and holding for 90 days after the the release of a flagship iPhone generated returns with an annualized Sharpe ratio of 2.26.
Investment Implications:
- AAPL stock outperforms the broader S&P 500 market more frequently in the days AFTER the release of a new iPhone generation product, but the days BEFORE the release of the new product offers potential for greater magnitude of outperformance.
- The Cupertino, Californa-based technology giant is the most valuable company in the world, with an equity market cap exceeeding $2.5 trillion, and in 2020 AAPL became the first company ever to exceed $1 trillion in market cap. Active managers, especially those that strive for relative gains, must have an opinion on AAPL as it is often a significant allocation to industry-wide benchmarks (AAPL is 6.8% of the S&P500, 12.4% of the Nasdaq 100, and 20.1% of the iShares Technology index).
- Expanding the dataset using appropriate fundamental valuation metrics provided by Bloomberg or another data provider offers more data to test for patterns and alpha signals.
Assumptions:
- I operate under the assumption that the stock market is forward-looking and embeds expectations about future growth and economic conditions. From an individual stock perspective, sell-side analysts will project forward-looking financials based on commentary from company management, product cycles, economic conditions, competition, etc. As it relates to AAPL, I assume that analysts will factor in future iPhone product launches into forward-looking projections.
- As a result, I assume that as the market anticipates the launch of the newest iPhone iteration, analysts will increase their forward-looking estimates. The increase in expectations should be a driver of stock gains.
- But there is no free lunch in economics, and the signal from an expected product launch should decay over time as market participants reflect their expectations, using prior product cycles and stock performance as a rule of thumb.
Data:
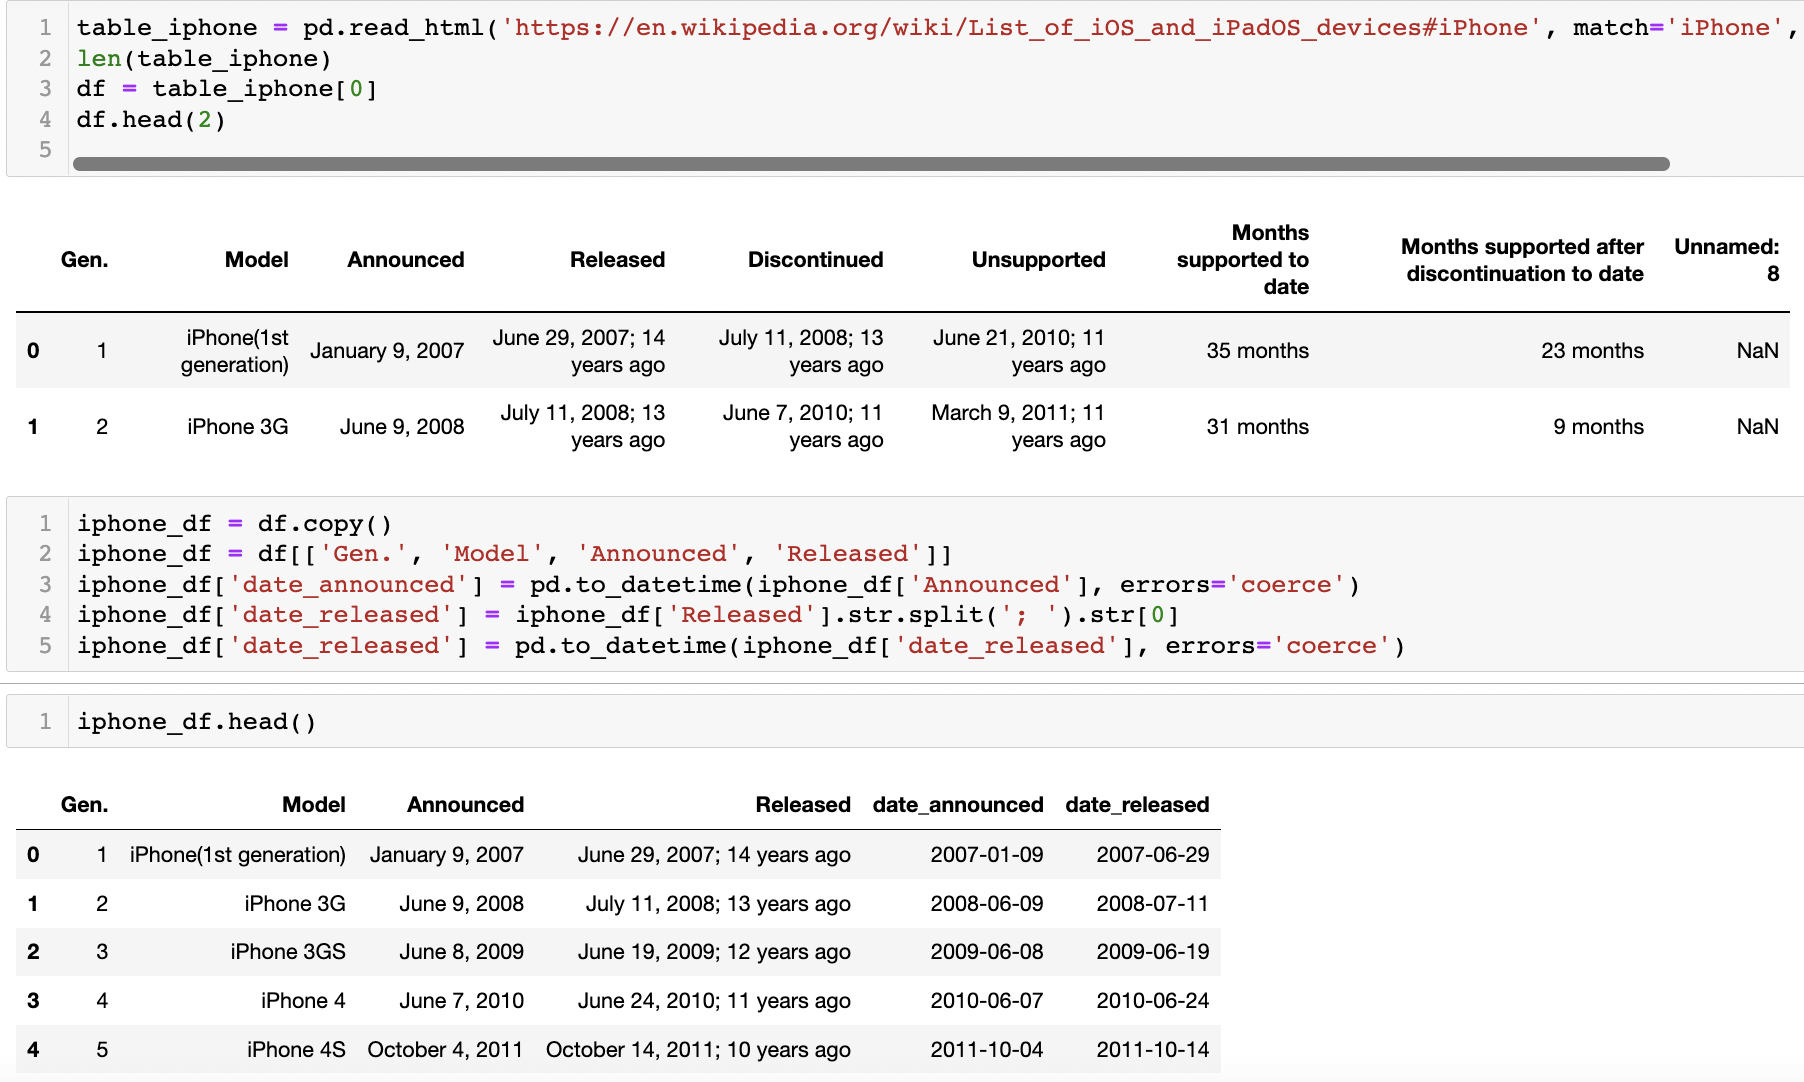
- I used 3 data sets for my analysis. 1) I used 'pandas.read_html()' to pull in data from the iPhone Wikipedia site for product announcement and product release dates.
2) I pulled in AAPL stock price data (adjusted for stock splits) from the Nasdaq website. 3) I pulled in S&P 500 data from the St. Louis Federal Reserve.
- Summaries of data sets are located here: AAPL price data & SP500 price data.
Methodology:
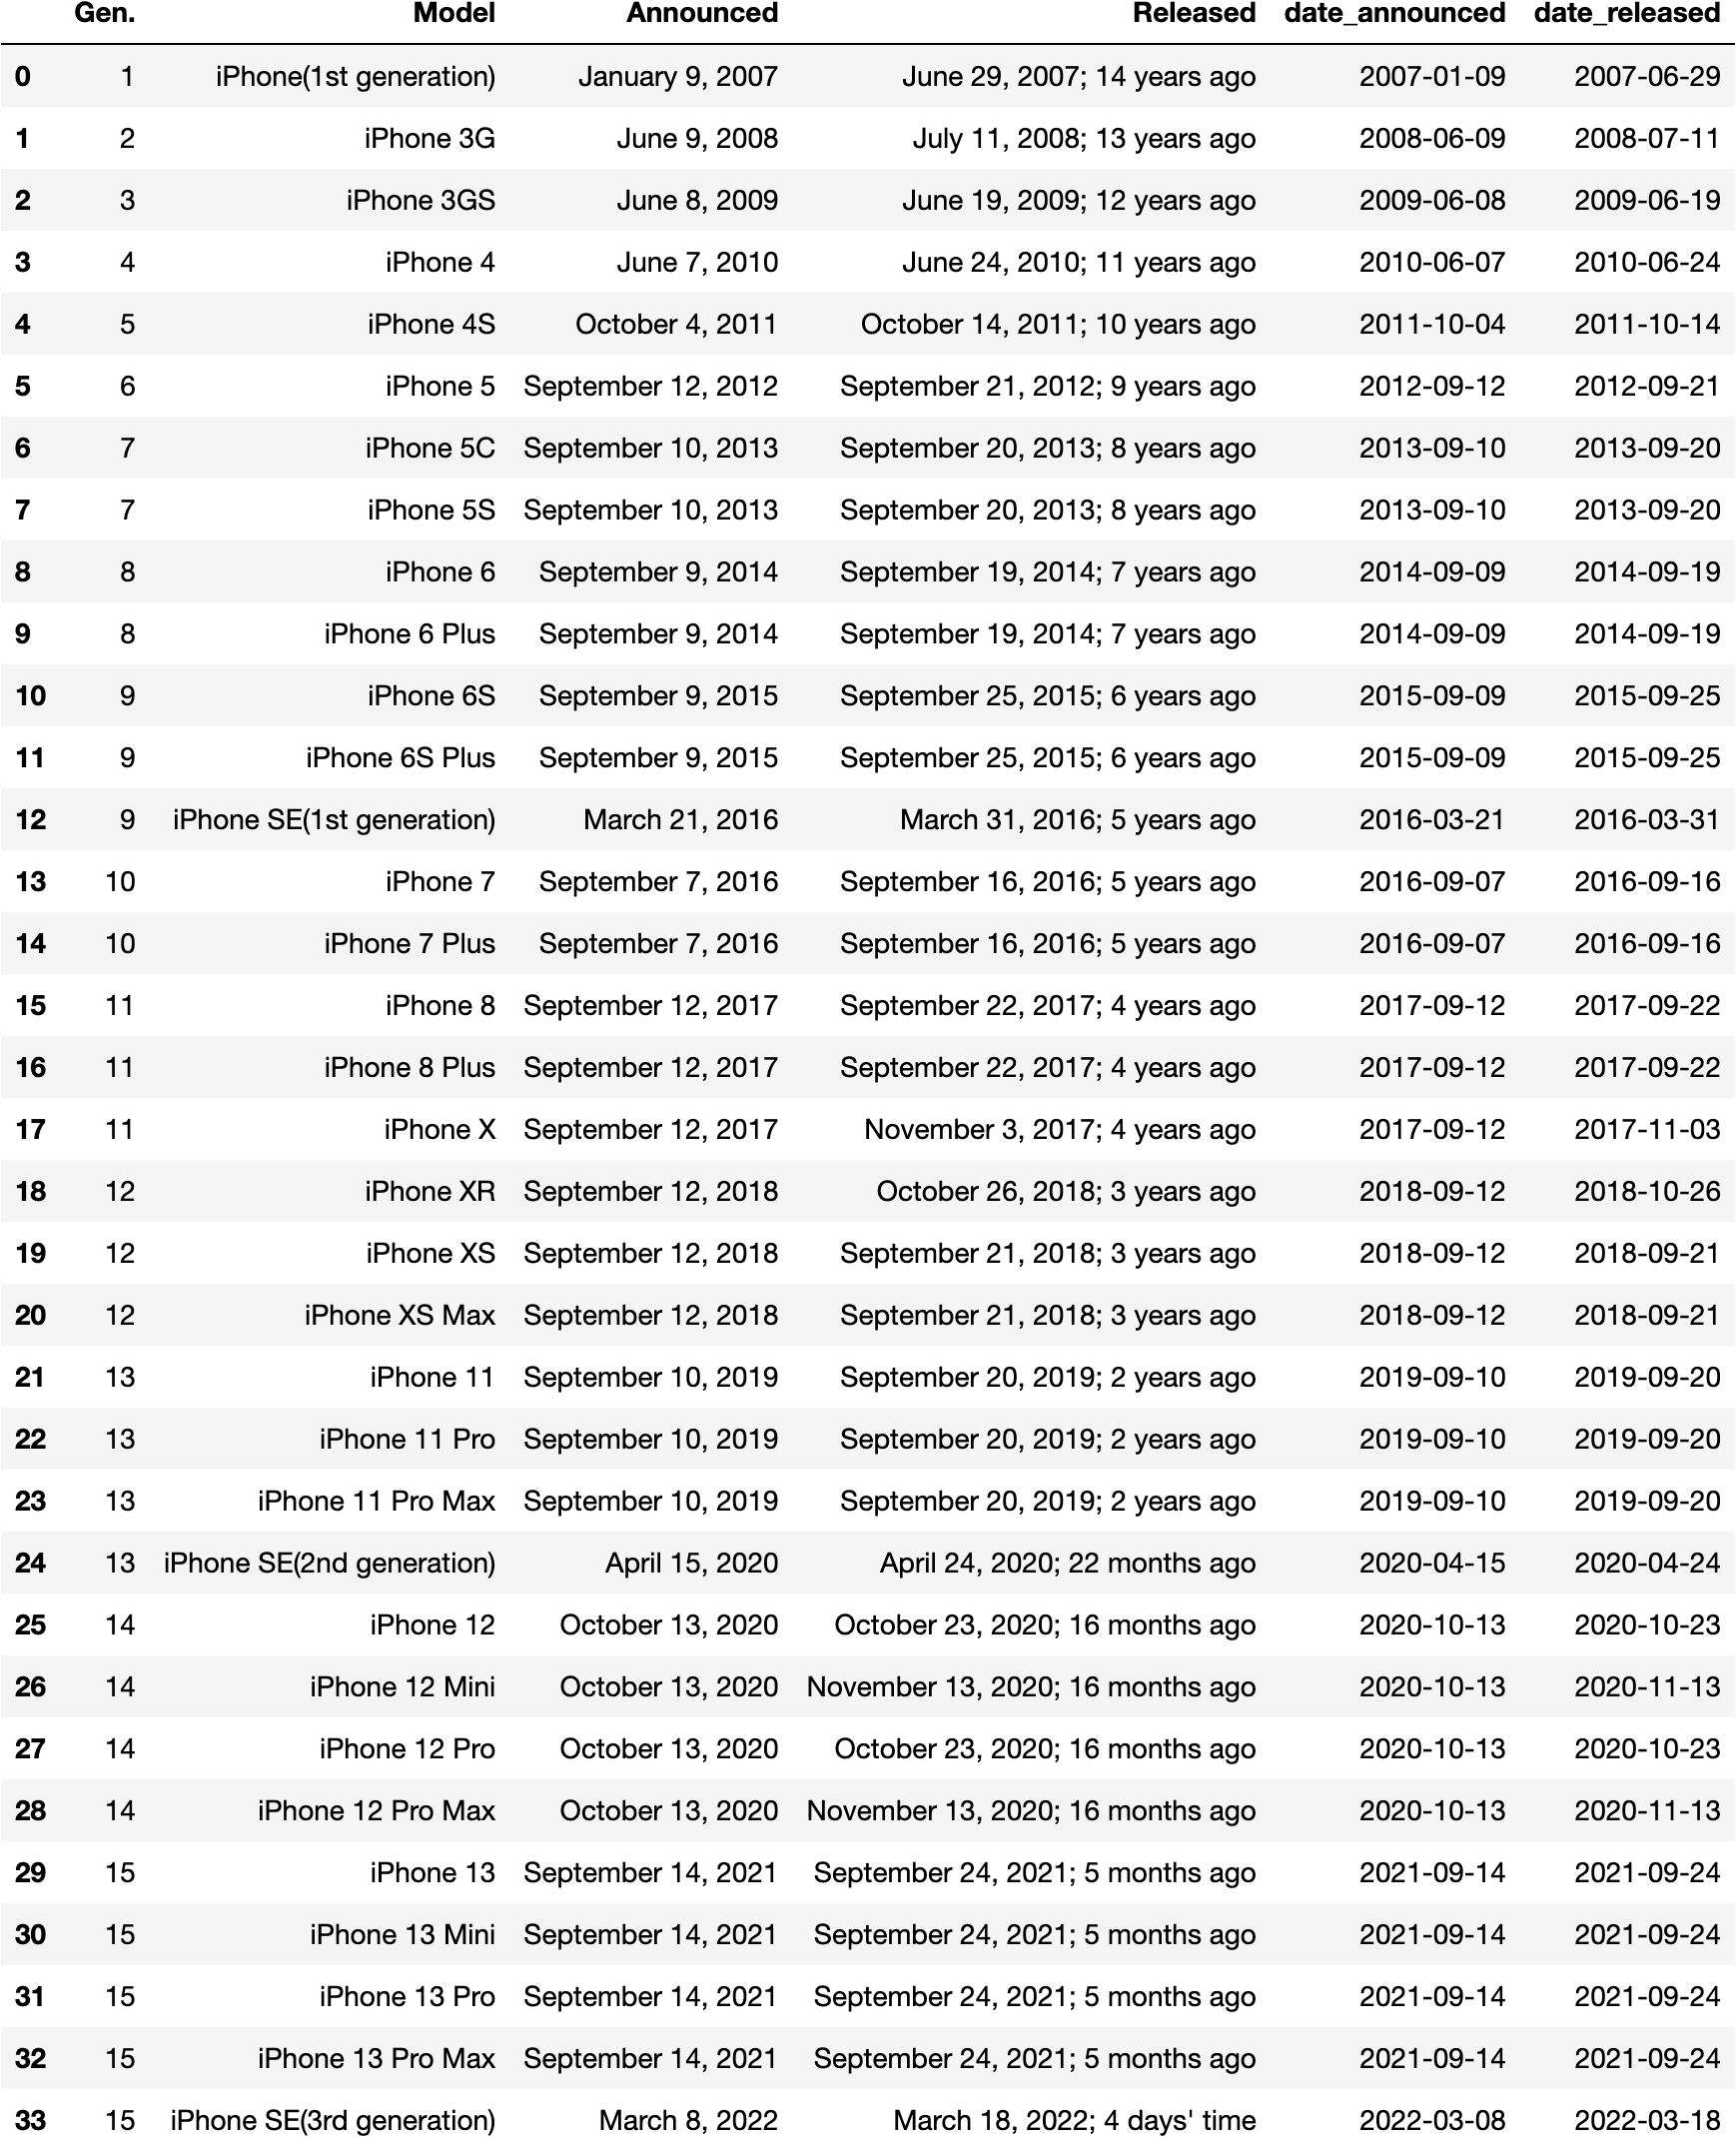
- I started by using pandas to download iPhone product release data from the iPhone wikipedia website, which I converted into a DataFrame
- Next I downloaded pricing date for AAPL
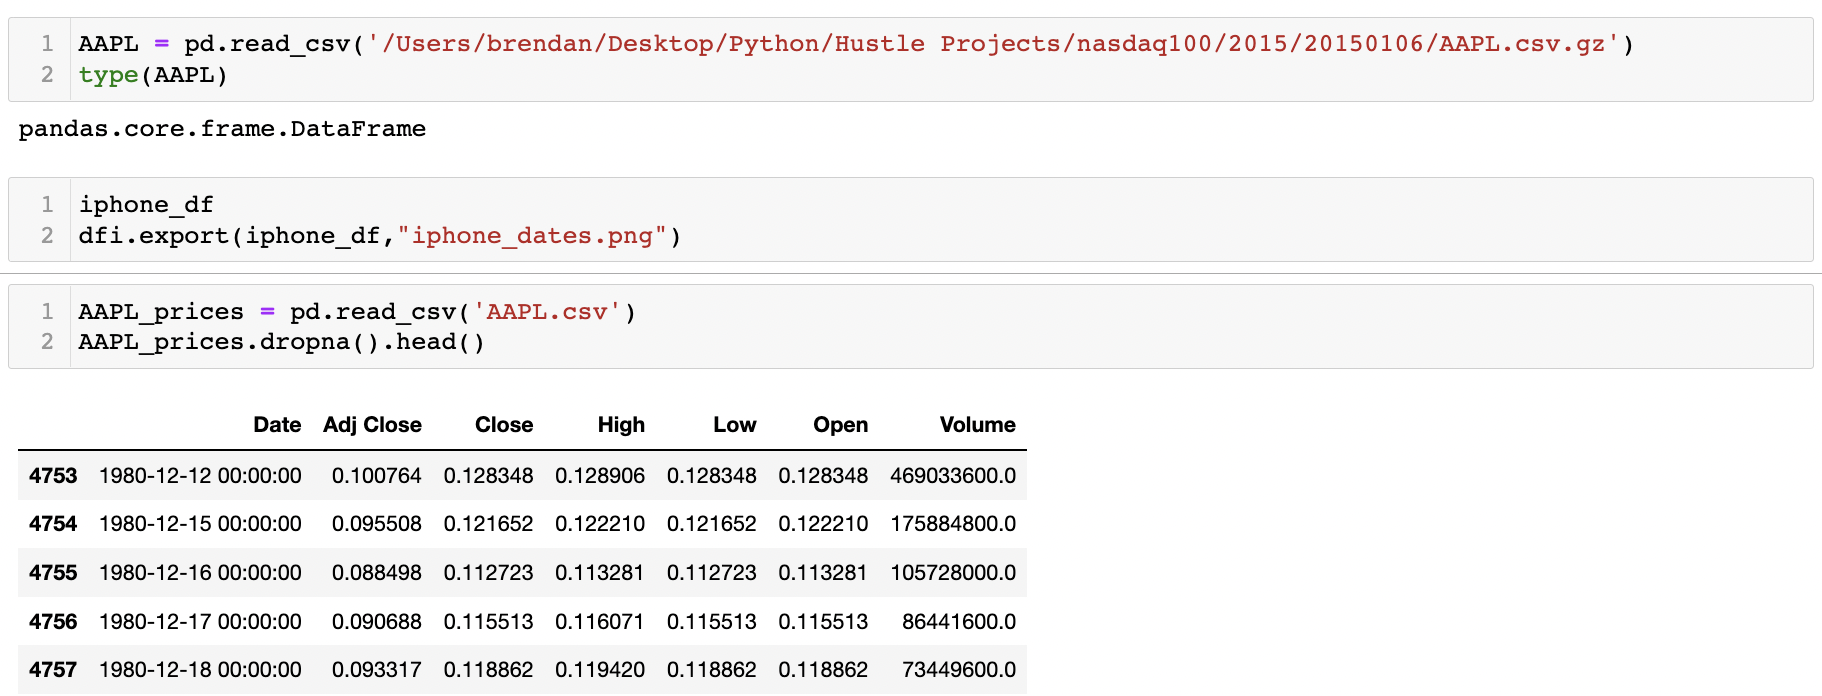
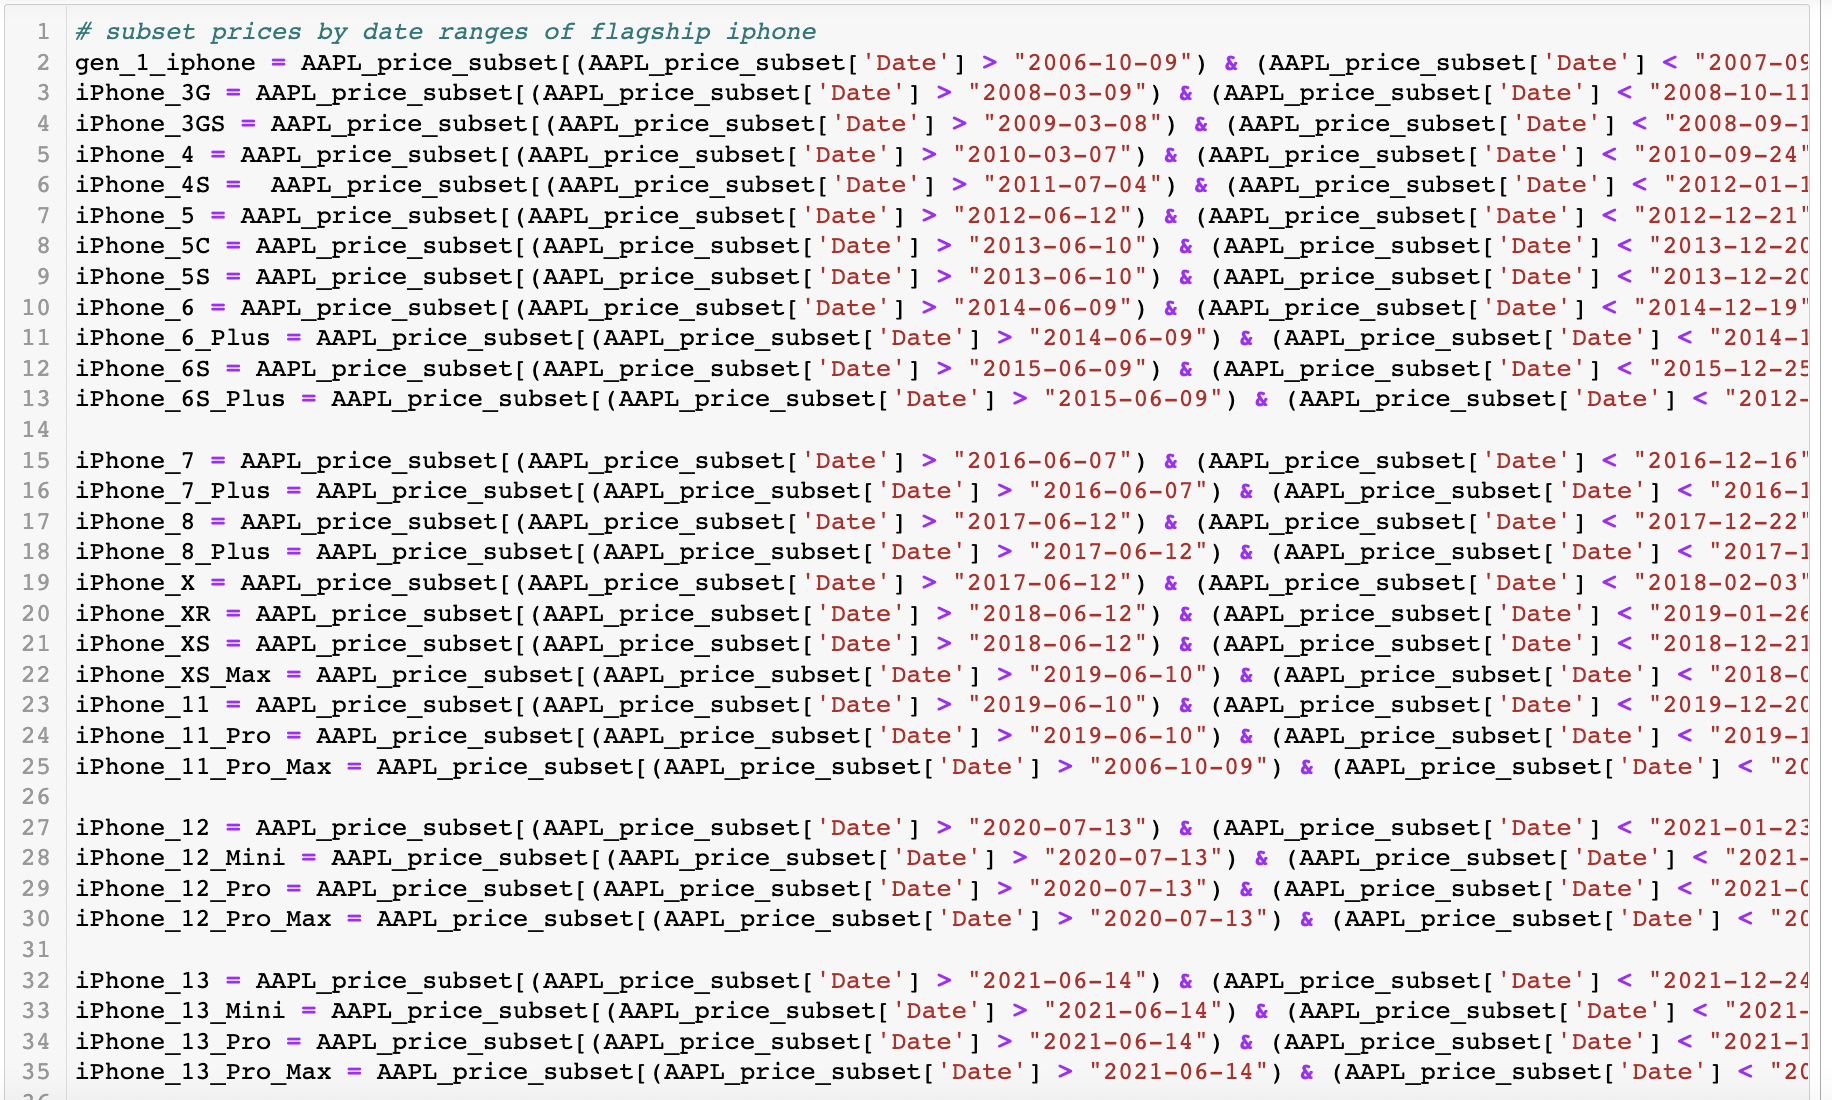
- Then I merged the data and subset AAPL pricing data to match iPhone product data
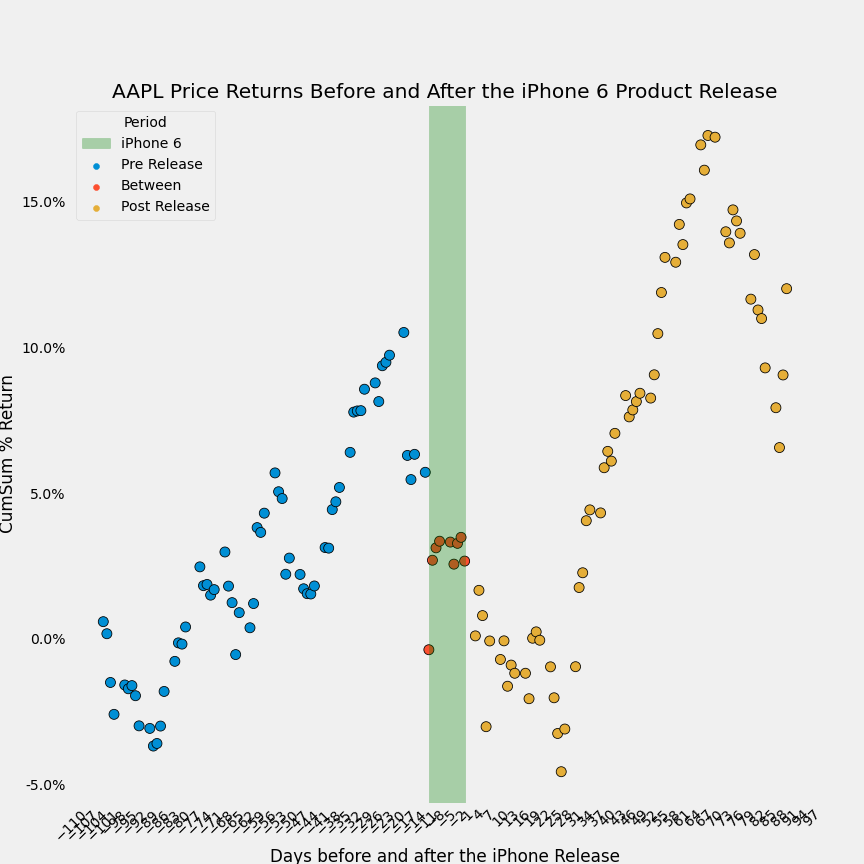
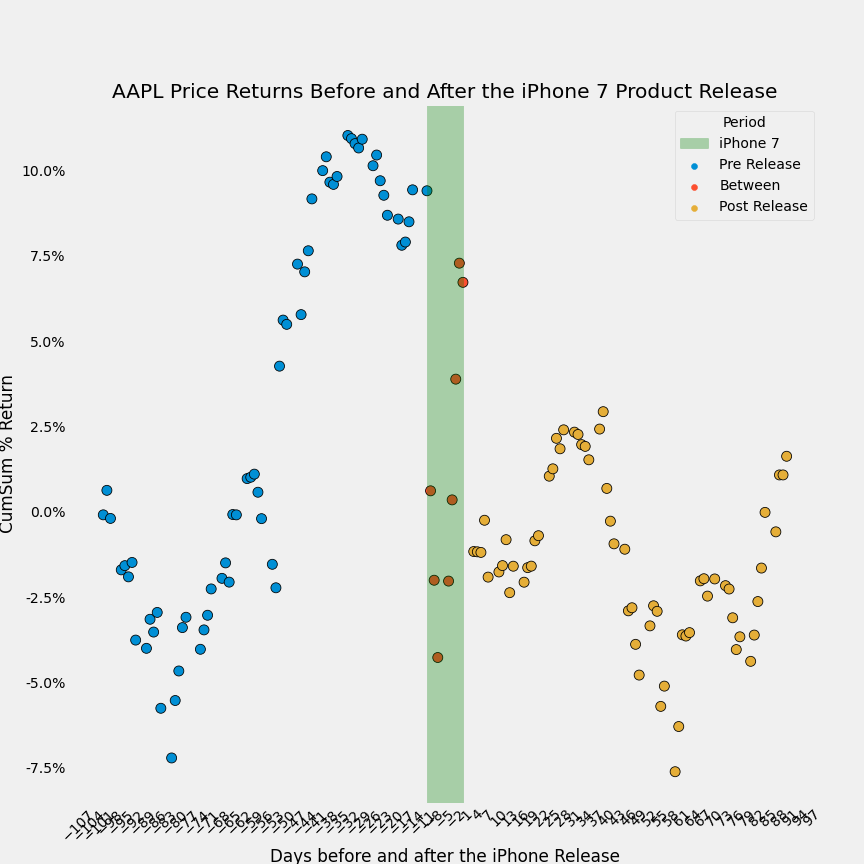
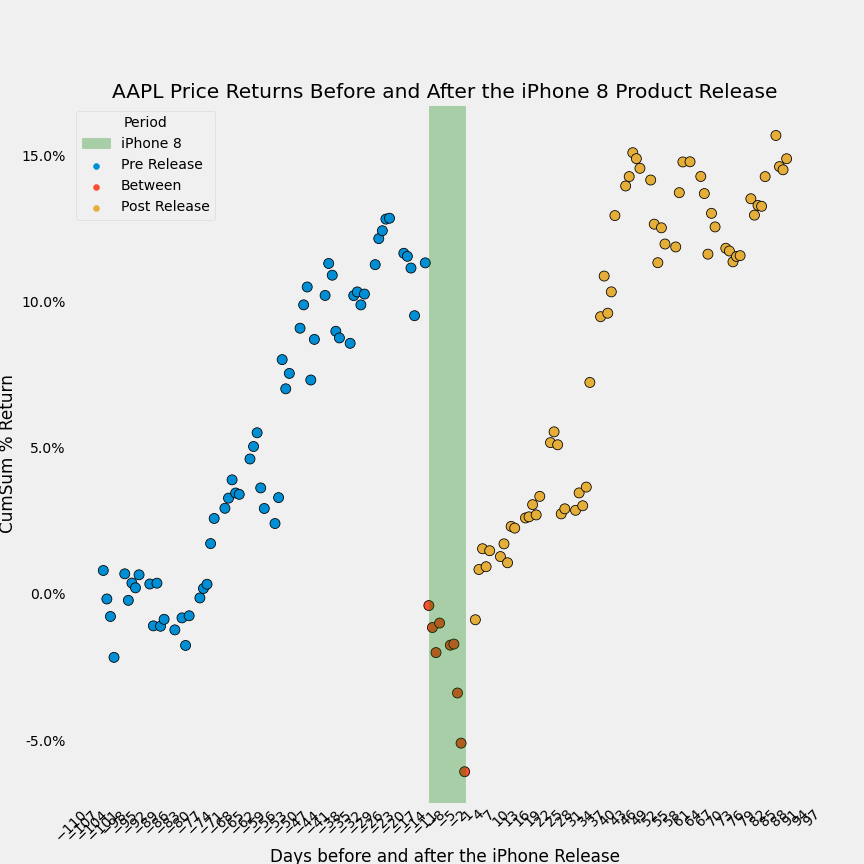
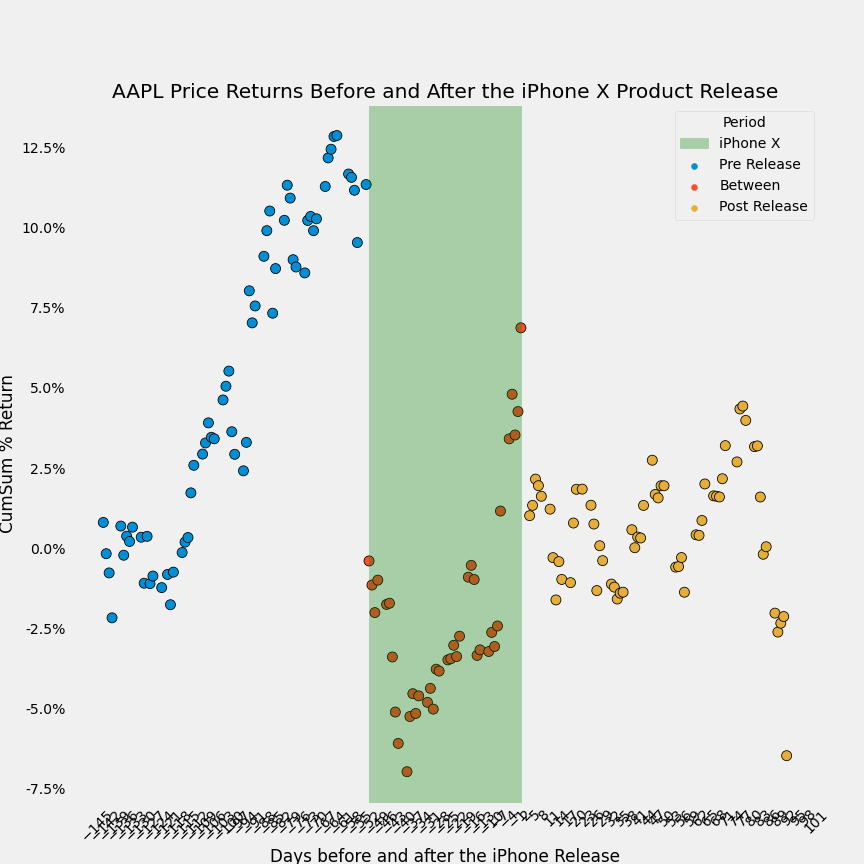
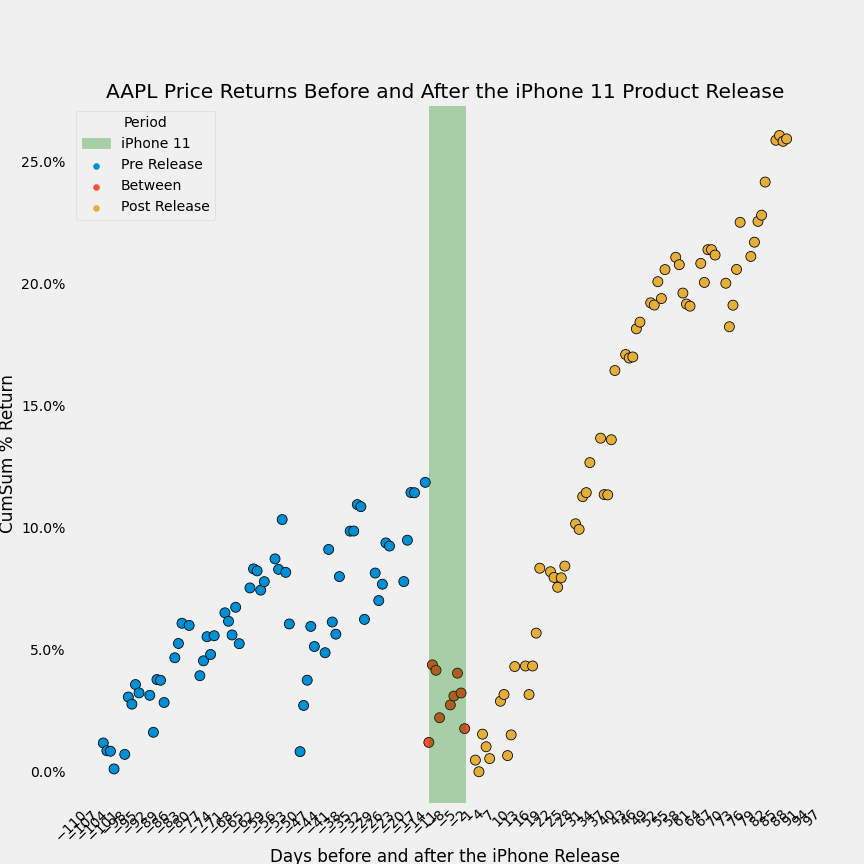
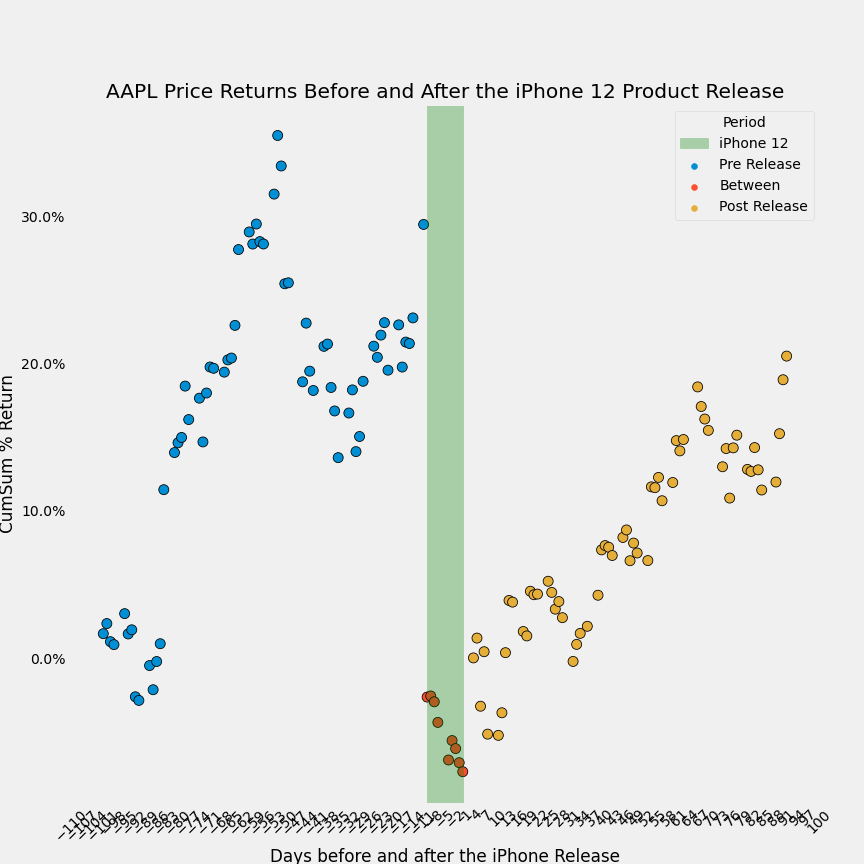
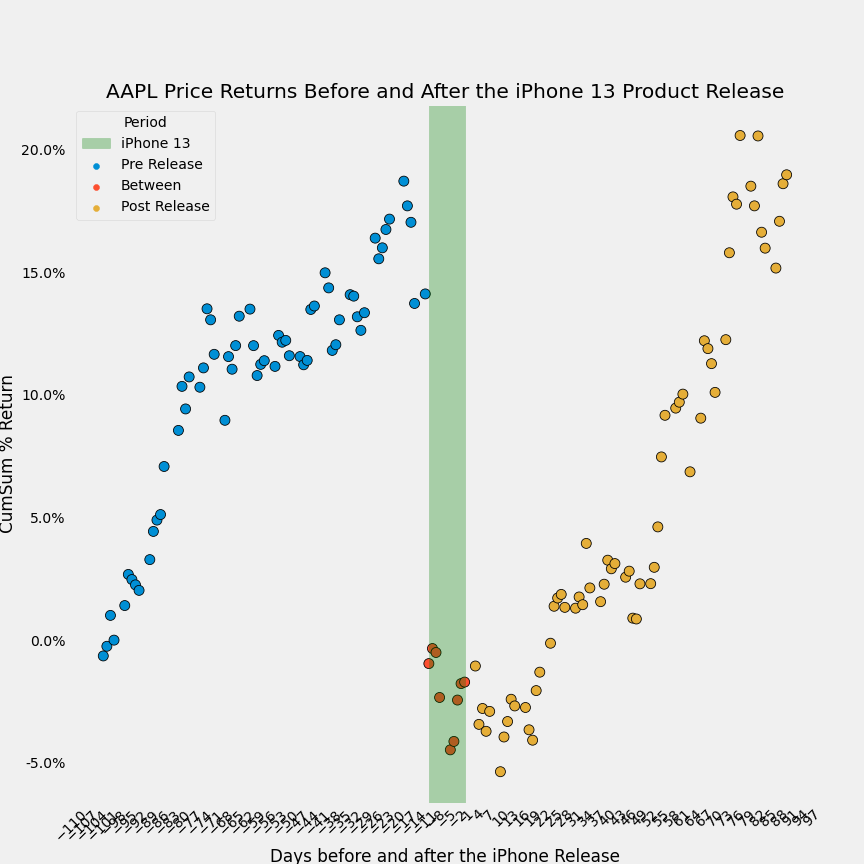
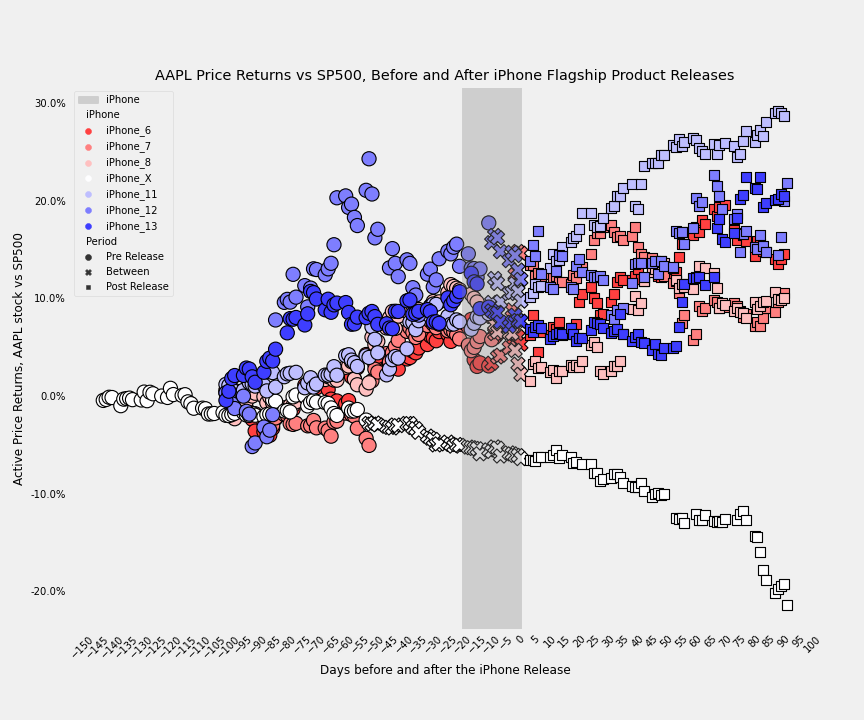
- And finally I visualize the data. The below shows cumulative returns of AAPL stock starting 90 days before the iPhone product announcement, running to 90 days after the product release, with each color representing a different iPhone generation
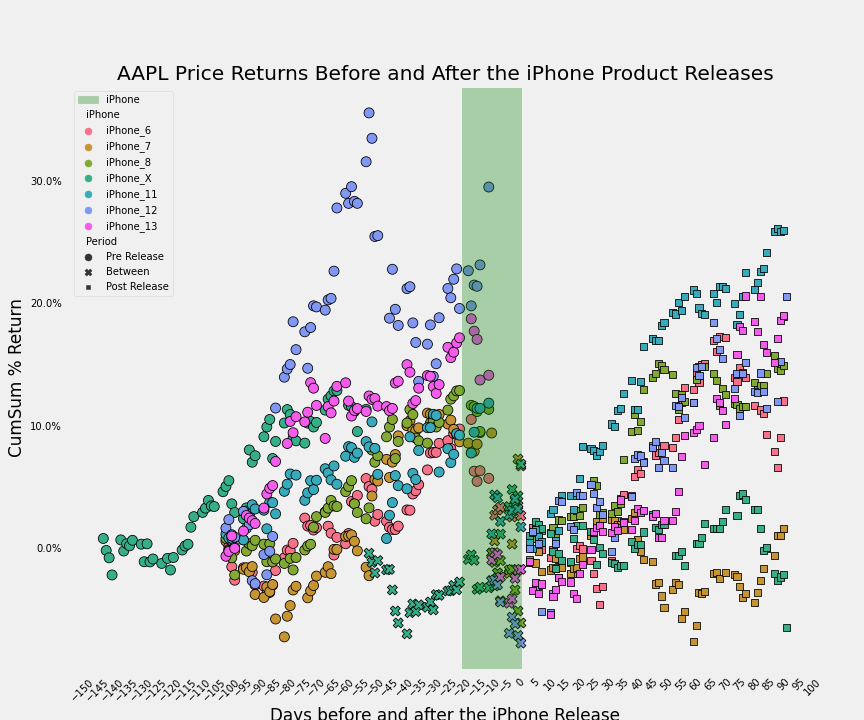
- The visualization is informative but inconclusive, so next I use python to partition the data into 10-day trading cohorts, then I take the average of each of these cohorts, and compare to S&P500 price returns over the same time periods

Appendix:
- See below for a time series visualization of shares of AAPL before and after product announcements and releases for the iPhone 6, iPhone 7, iPhone 8, iPhone X, iPhone 11, iPhone 12 and iPhone 13
