Rebounds and Rings: Thoughts and observations (a rant?) from 20 years as an NBA fanatic - with assistance from BeautifulSoup, Pandas, MatplotLib and Altair
November 15, 2021
I love basketball and I love the NBA. I think what I like most about the league is the competitive meritocracy where a player from virtually anywhere can succeed as long as he can play -- it is a make or miss league. Case in point, for the first 18 years of his life, Giannis Antetokounmpo, who was born in Greece the son of Nigerian parents, grew up poor, sometimes homeless, and effectively stateless due to Greek nationality laws concerning how he came to Greece. Now at the age of 26, Giannis, who stands 6'11" with a 7 foot wing span, is a 2-time MVP, perennial All-Star and most recently he scored 50 points in the deciding game to clinch the championship for the 2021 season. Amazing - all he needed was a ball and a hoop.
For the past 20 years I have devoured the NBA and watched most Boston Celtics games over the time period (20 seasons at 82 games per season is 1,640 games), and even purchased season's tickets for the 2013-2015 Celtics seasons (43 home games per season). So yes, I love basketball. Python proved extremely useful for analyzing how the league has changed since 2000 when I watched my first Celtics game on tv.
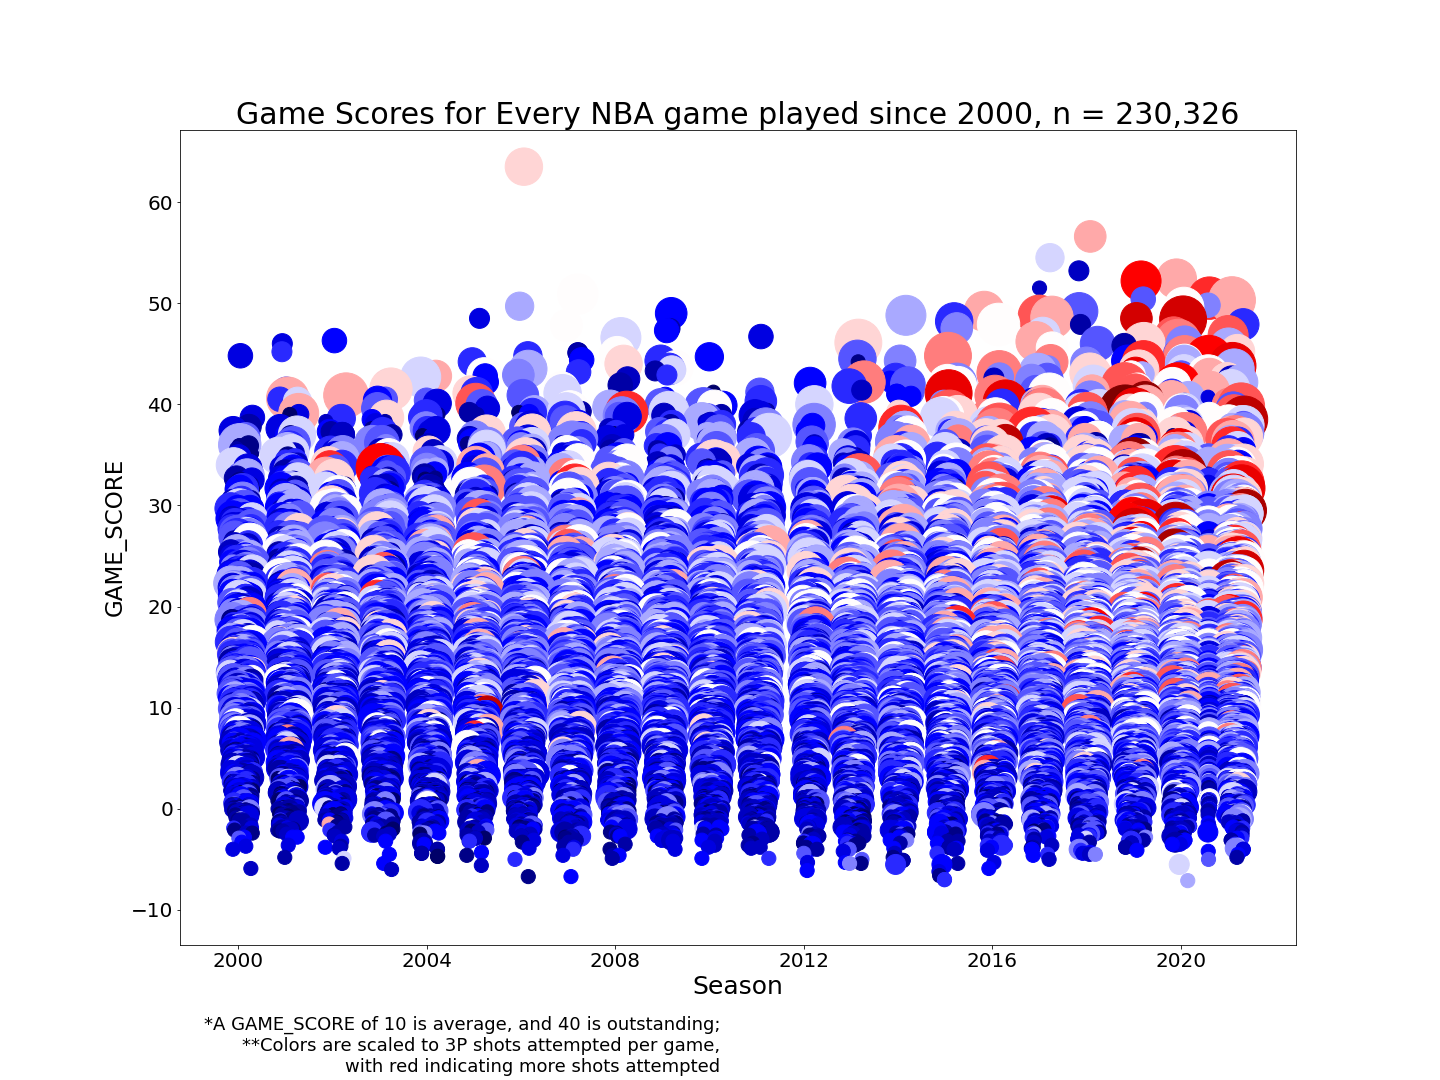
Before diving in you should know that much of the ranking analysis relies on using the Game Score metric, which is derived to standardize across all games, and provides a single measurement of a player's productivity for a single game. The metric is standardized such that a total of 40 points would be considered an outstanding performance, whereas 10 points is an average performance. **The formula for Game Score is: 'PTS + 0.4 * FG - 0.7 * FGA - 0.4*(FTA - FT) + 0.7 * ORB + 0.3 * DRB + STL + 0.7 * AST + 0.7 * BLK - 0.4 * PF - TOV'.

The Dataset
- I used an API, web scraping, and Pandas to get all game-logs from each player for each team since the 2000 season. Much of my data collection relied on the excellent Basketball-Reference website, which has compiled statistics for seemingly every NBA game and NBA player that has ever played (and even data on the defunct ABA league). For each of the 30 franchises in the NBA, I wrote code that pulled in the game log (an individual player's stats during a game) for each player on every team for each of the 82 games played for each season since 2000.
- All in, my dataset has 230,326 values. For a well summarized look at the dataset, using a sample of 10,000 values (this for memory preservation), please click here.
See below for scorching hot takes:
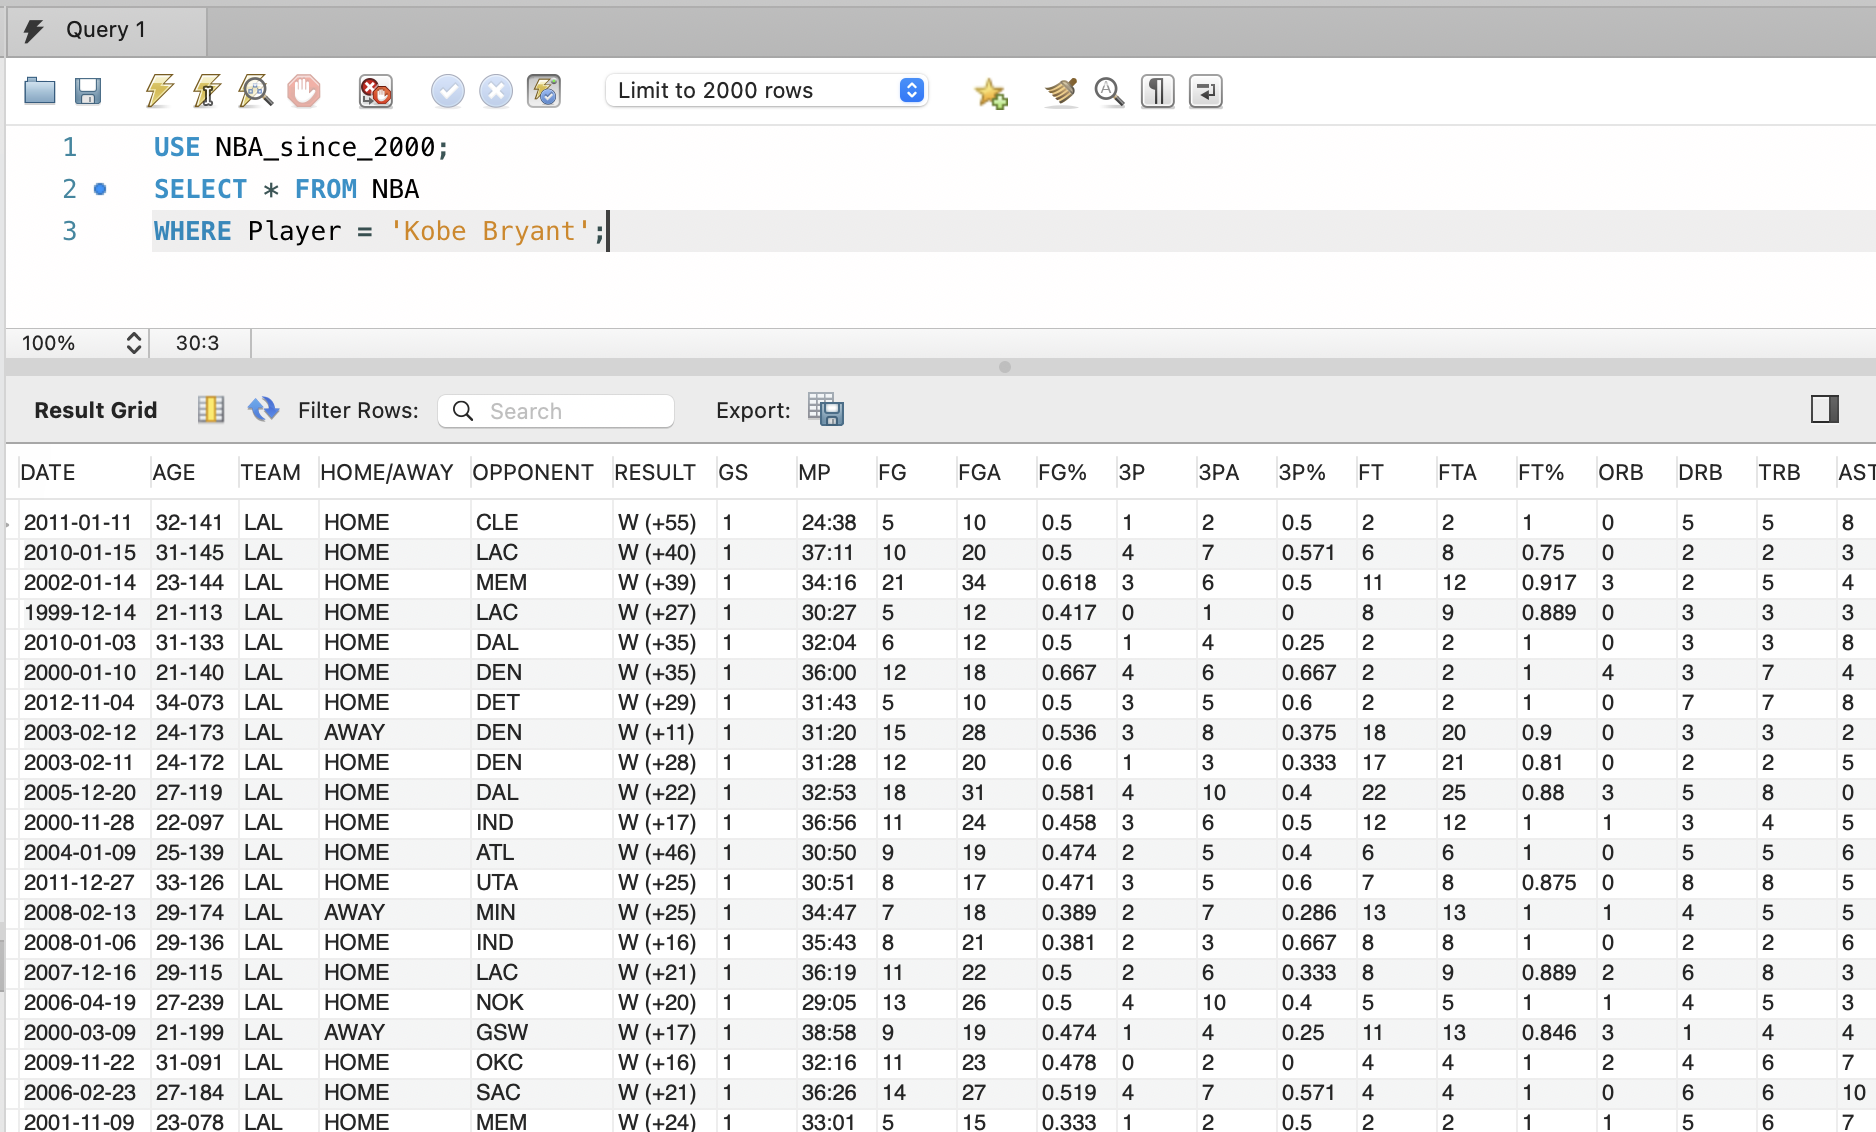
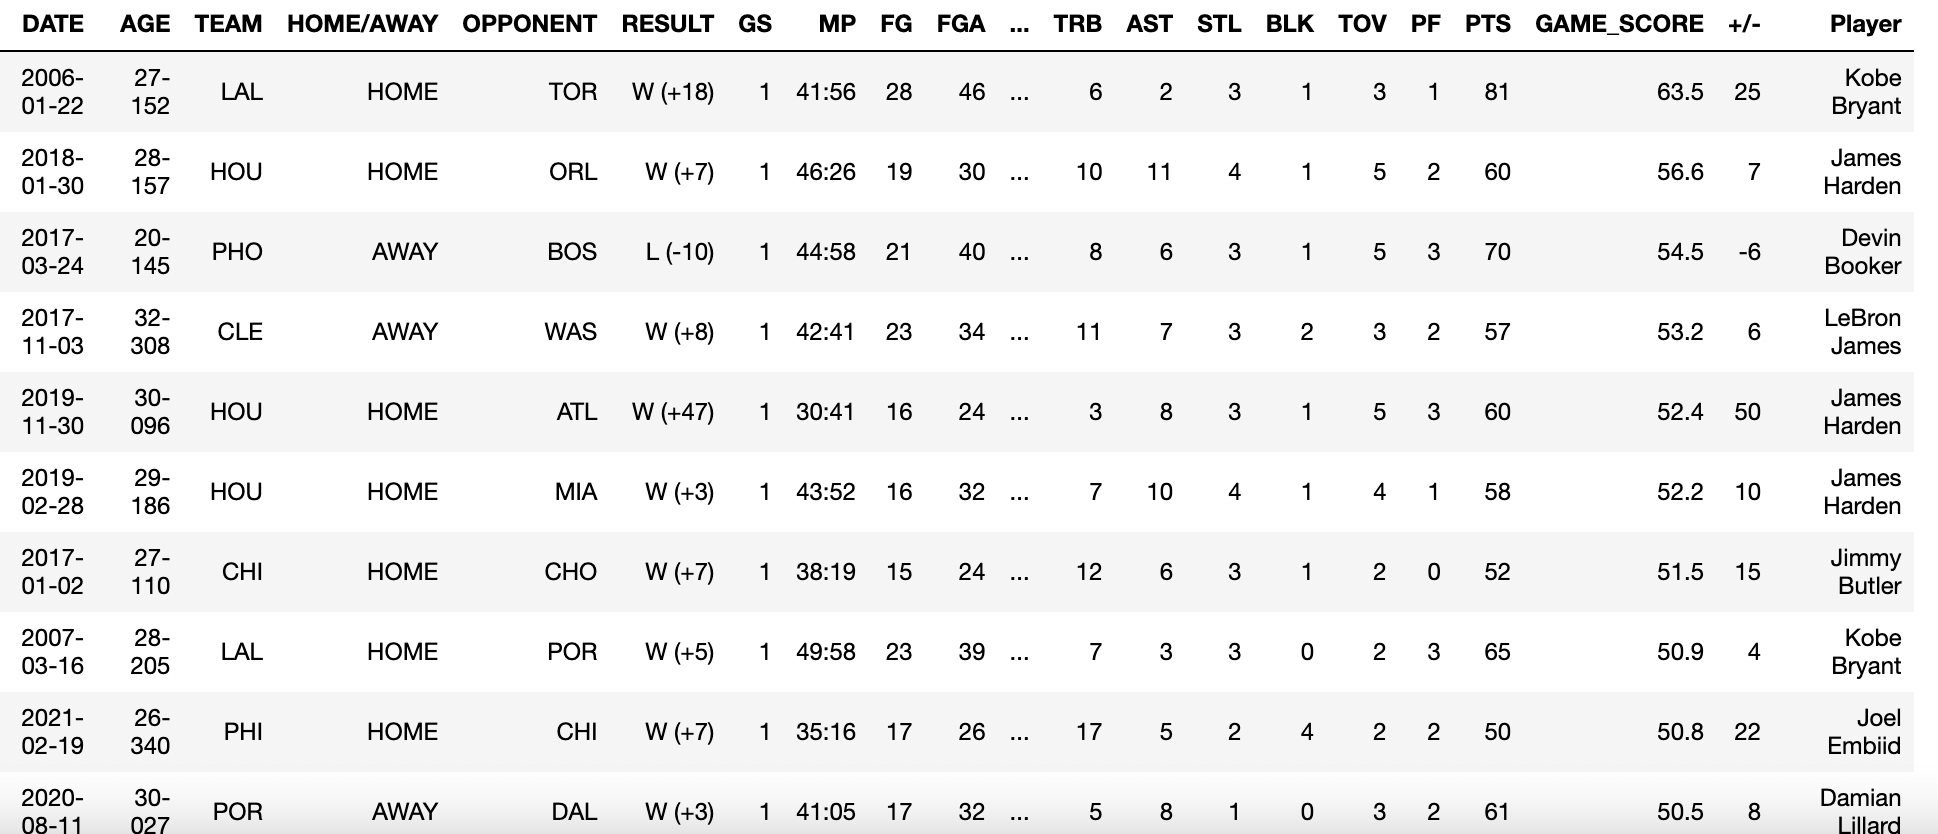
- The best individual game during the past 20 years came from Kobe Bryant (Rest in Peace) in the 2006 season, when he scored 81 points, the 2nd highest in league history, to beat the Toronto Raptors. The next best game was a 60 point triple-double by James Harden, followed by a 70 point game by Devin Booker (the 3rd most points in a single game of all time).
- The best player over the time period spanning from 2000-2021, purely looking at statistics and excluding the postseason, was LeBron James, followed next by Kevin Durant and then James Harden. When using a cumulative +/- method, the best players was Tim Duncan, followed by LeBron James, Stephen Curry, Chris Paul and then Kevin Durant.
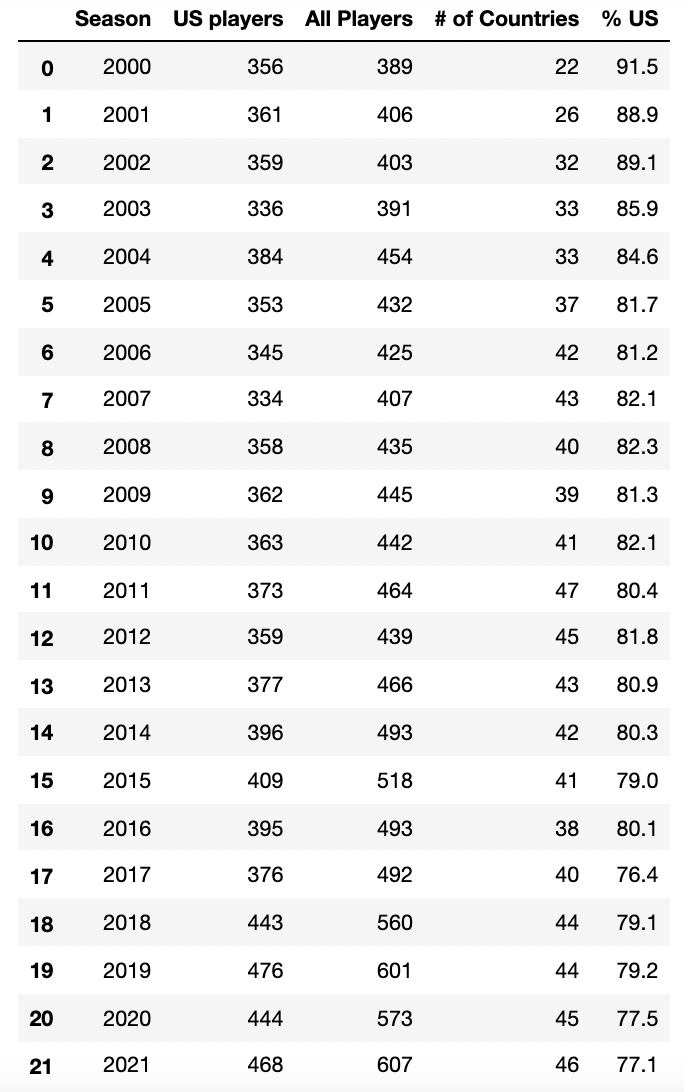
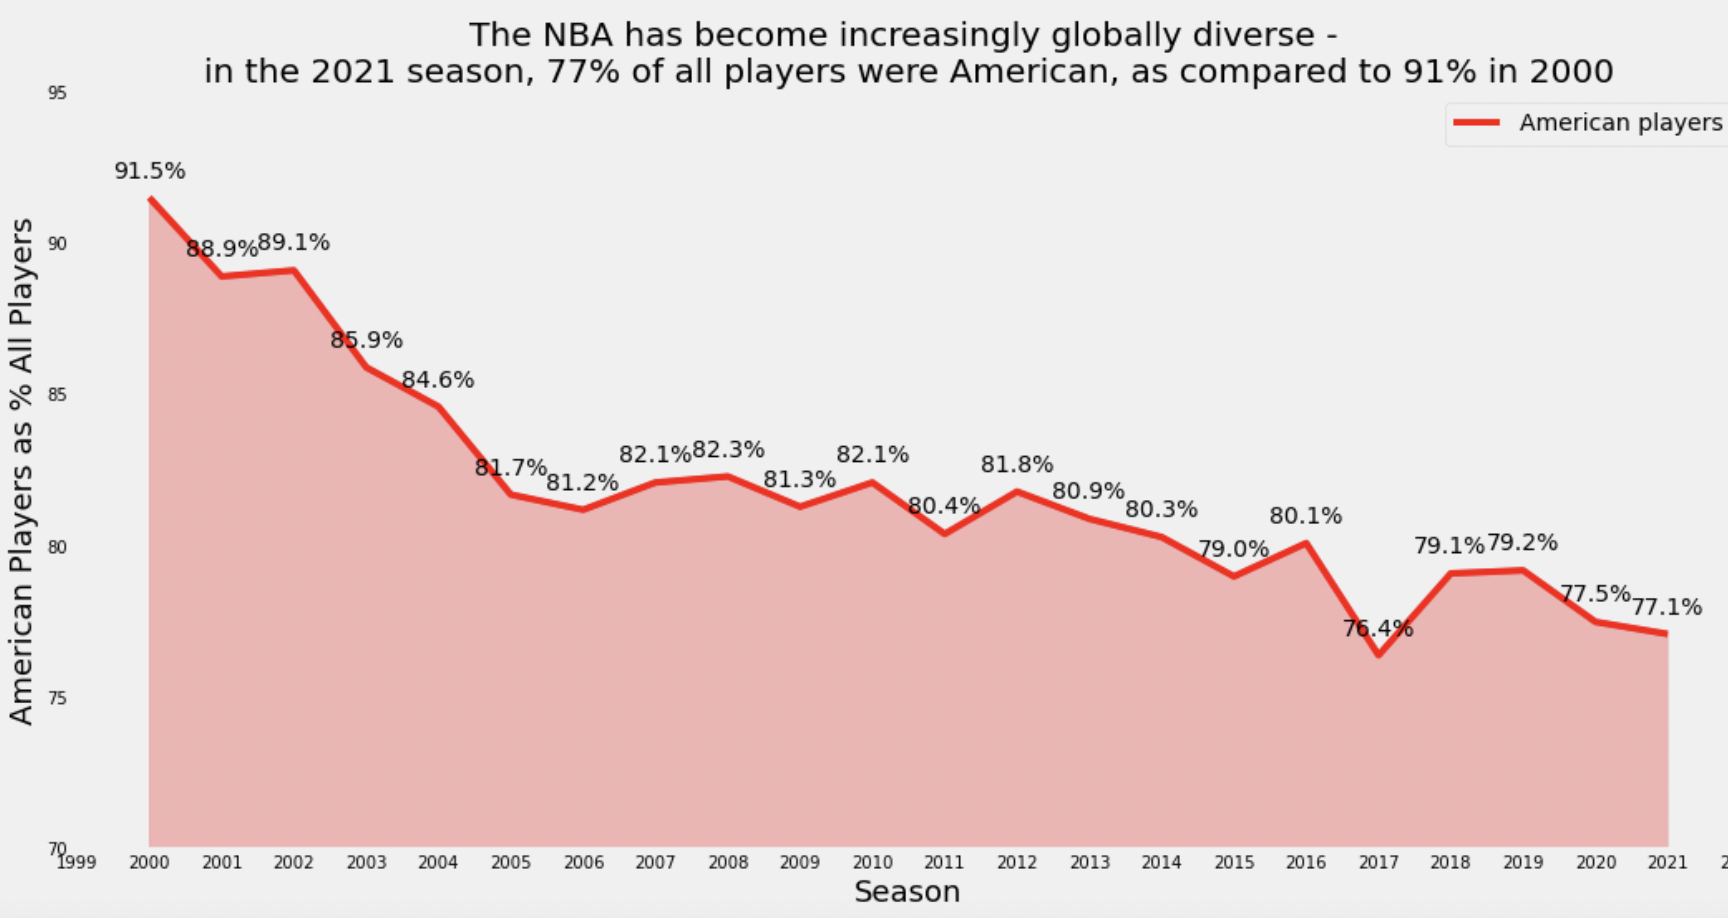
- The influx of international talent is undeniable and the game is the better for it. 389 players from 22 different countries played during the 2000 NBA season; 91.5% of these players were American. Flash forward to 2020, where 607 total players (roster sizes expanded) from 46 different countries played a game, and 77.1% of these players were American. For the past 3 seasons, the league MVP has also been European, with Denver's Nikola Jokic the reigning MVP with Giannis Antetokounmpo having won back to back MVP awards starting in 2019. He also unanimously won the 2021 Finals MVP.
- To be the top player in the NBA for a given season, a player would have to average a minimum of 24 points, 6 rebounds and 4 assists. Out of the total 230,326 statlines over the prior 20 years, this individual statline - more than 24 points, 6 rebounds and 4 assists - has occured 4,239 times, or 1.8% of all games played. Out of all of the best players since 2000, Kevin Garnett averaged the lowest points per game, at 24.2, but he also averaged 14 rebounds with 5 assists and 2 blocks, which as an individual statline has occured 261 times, or 0.1% of all games played. Kevin Garnett was MVP in 2004.
- The most unique statline (n=230,320) of the past 20 years was recorded by Draymond Green of the Golden State Warriors. On February 10, 2017 in a game against Memphis, he pulled down 11 rebounds while dishing out 10 assists with 10 steals and 5 blocks... and 4 points. This was the first "triple-double" (when a player records double digit values in 3 statistical categories for a single game) in NBA history without scoring double-digits in points. He shot the ball 6 times, but ended up with a +/- score of 26. For reference, out of a total of 230,326 individual games played over the past 20 years, there has been a total of 1,090 triple-doubles (a 0.5% occurence). Based on this empirical data, the odds of tallying a triple double without points is 0.0005%. It was a once in a generation game.
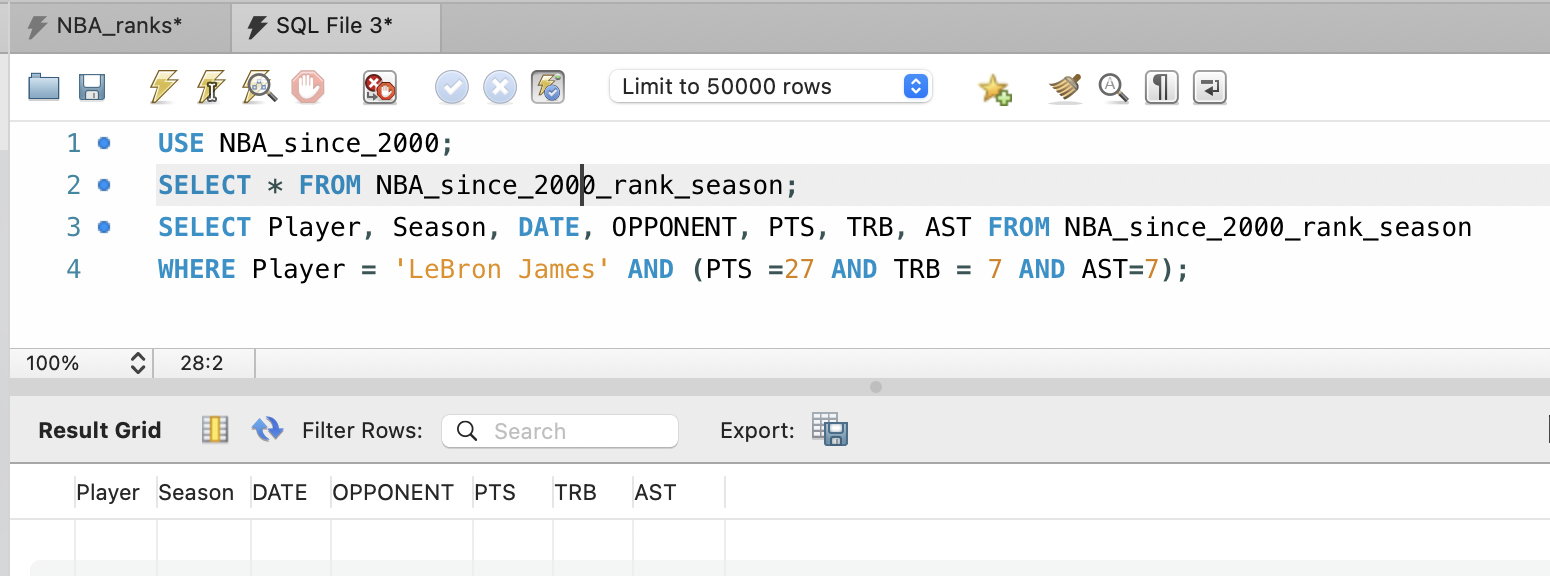
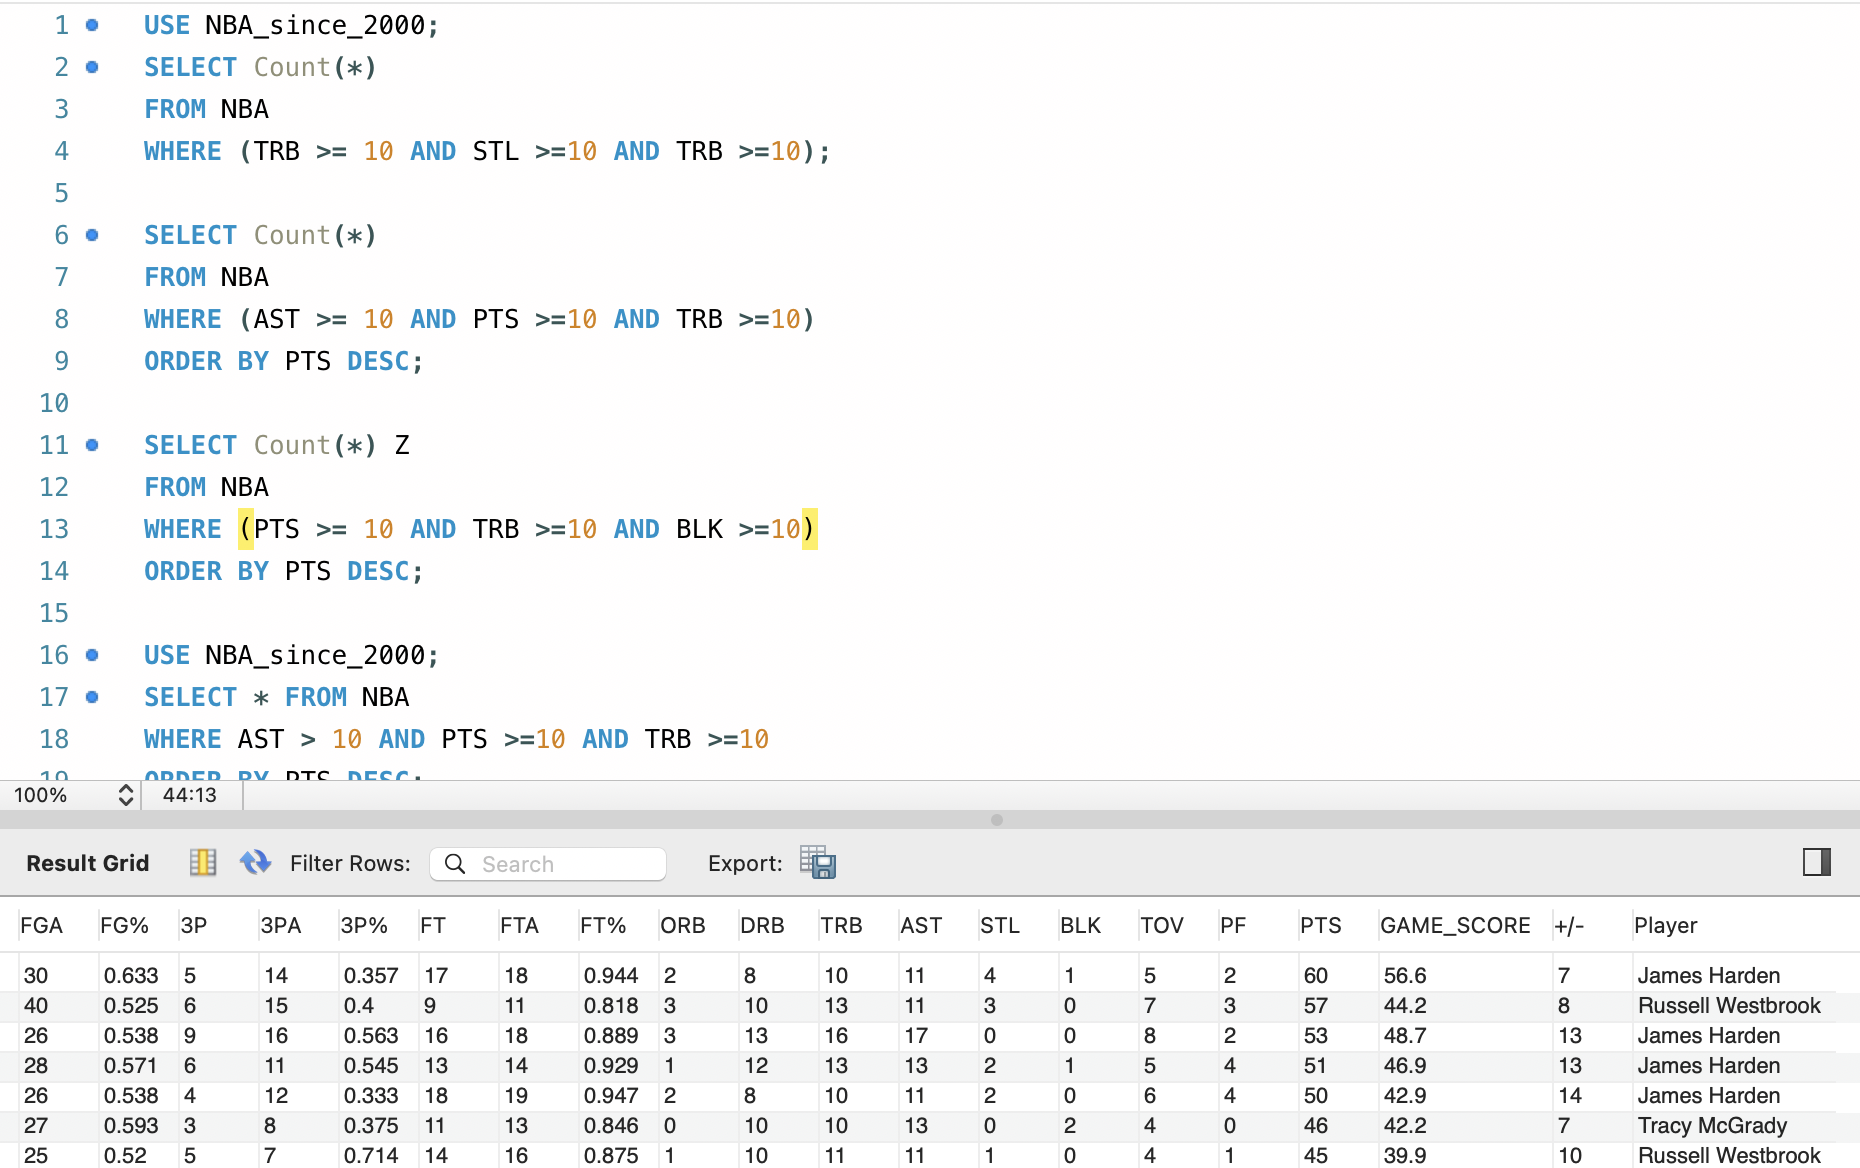
- Throughout his 19 year (and counting) career, LeBron James has averaged 27 points, 7 rebounds and 7 assists for each game. Yet across the 1,305 regular season games he has played, he has never had an individual game with 27 points, 7 rebounds and 7 assists. Amazing. This is corroborated by a SQL query which returns null values.
- It's often been said that the rhythmic and free-flowing nature of basketball makes the game comparable to jazz music. But in recent years, the increased emphasis of the 3-point shot makes the game more comparable to a Russian novel, where plot twists are abundant in the form of frequent comebacks, and no game is out of reach regardless of the deficit. Although the 3-point shot was introduced on a trial basis in 1980, the brilliant and mesmerizing Stephen Curry of the Golden State Warriors is widely known as the 3-point shot king and the best shooter the game has ever seen. He is so good at making 3-pointers that some in NBA circles have speculated that the league office will introduce a 4-point shot. As of writing, through 21 games in the 2021-2022 season he has already made 114 3-pointers; in the 1986 season basketball legend Larry Bird of the Boston Celtics made 82 3-pointers for the entire season! For an interactive visualization of Stephen Curry's career 3-point dominance - made using the python package Altair - please see the link here.


Random Thought 1: Top 25 players of the past 20 years:
Methodology: From the original dataset (n=230,326), I used the groupby function to group by player, then averaged each statistical category to arrive at career average stats, and finally ranked by highest Game_Score average.
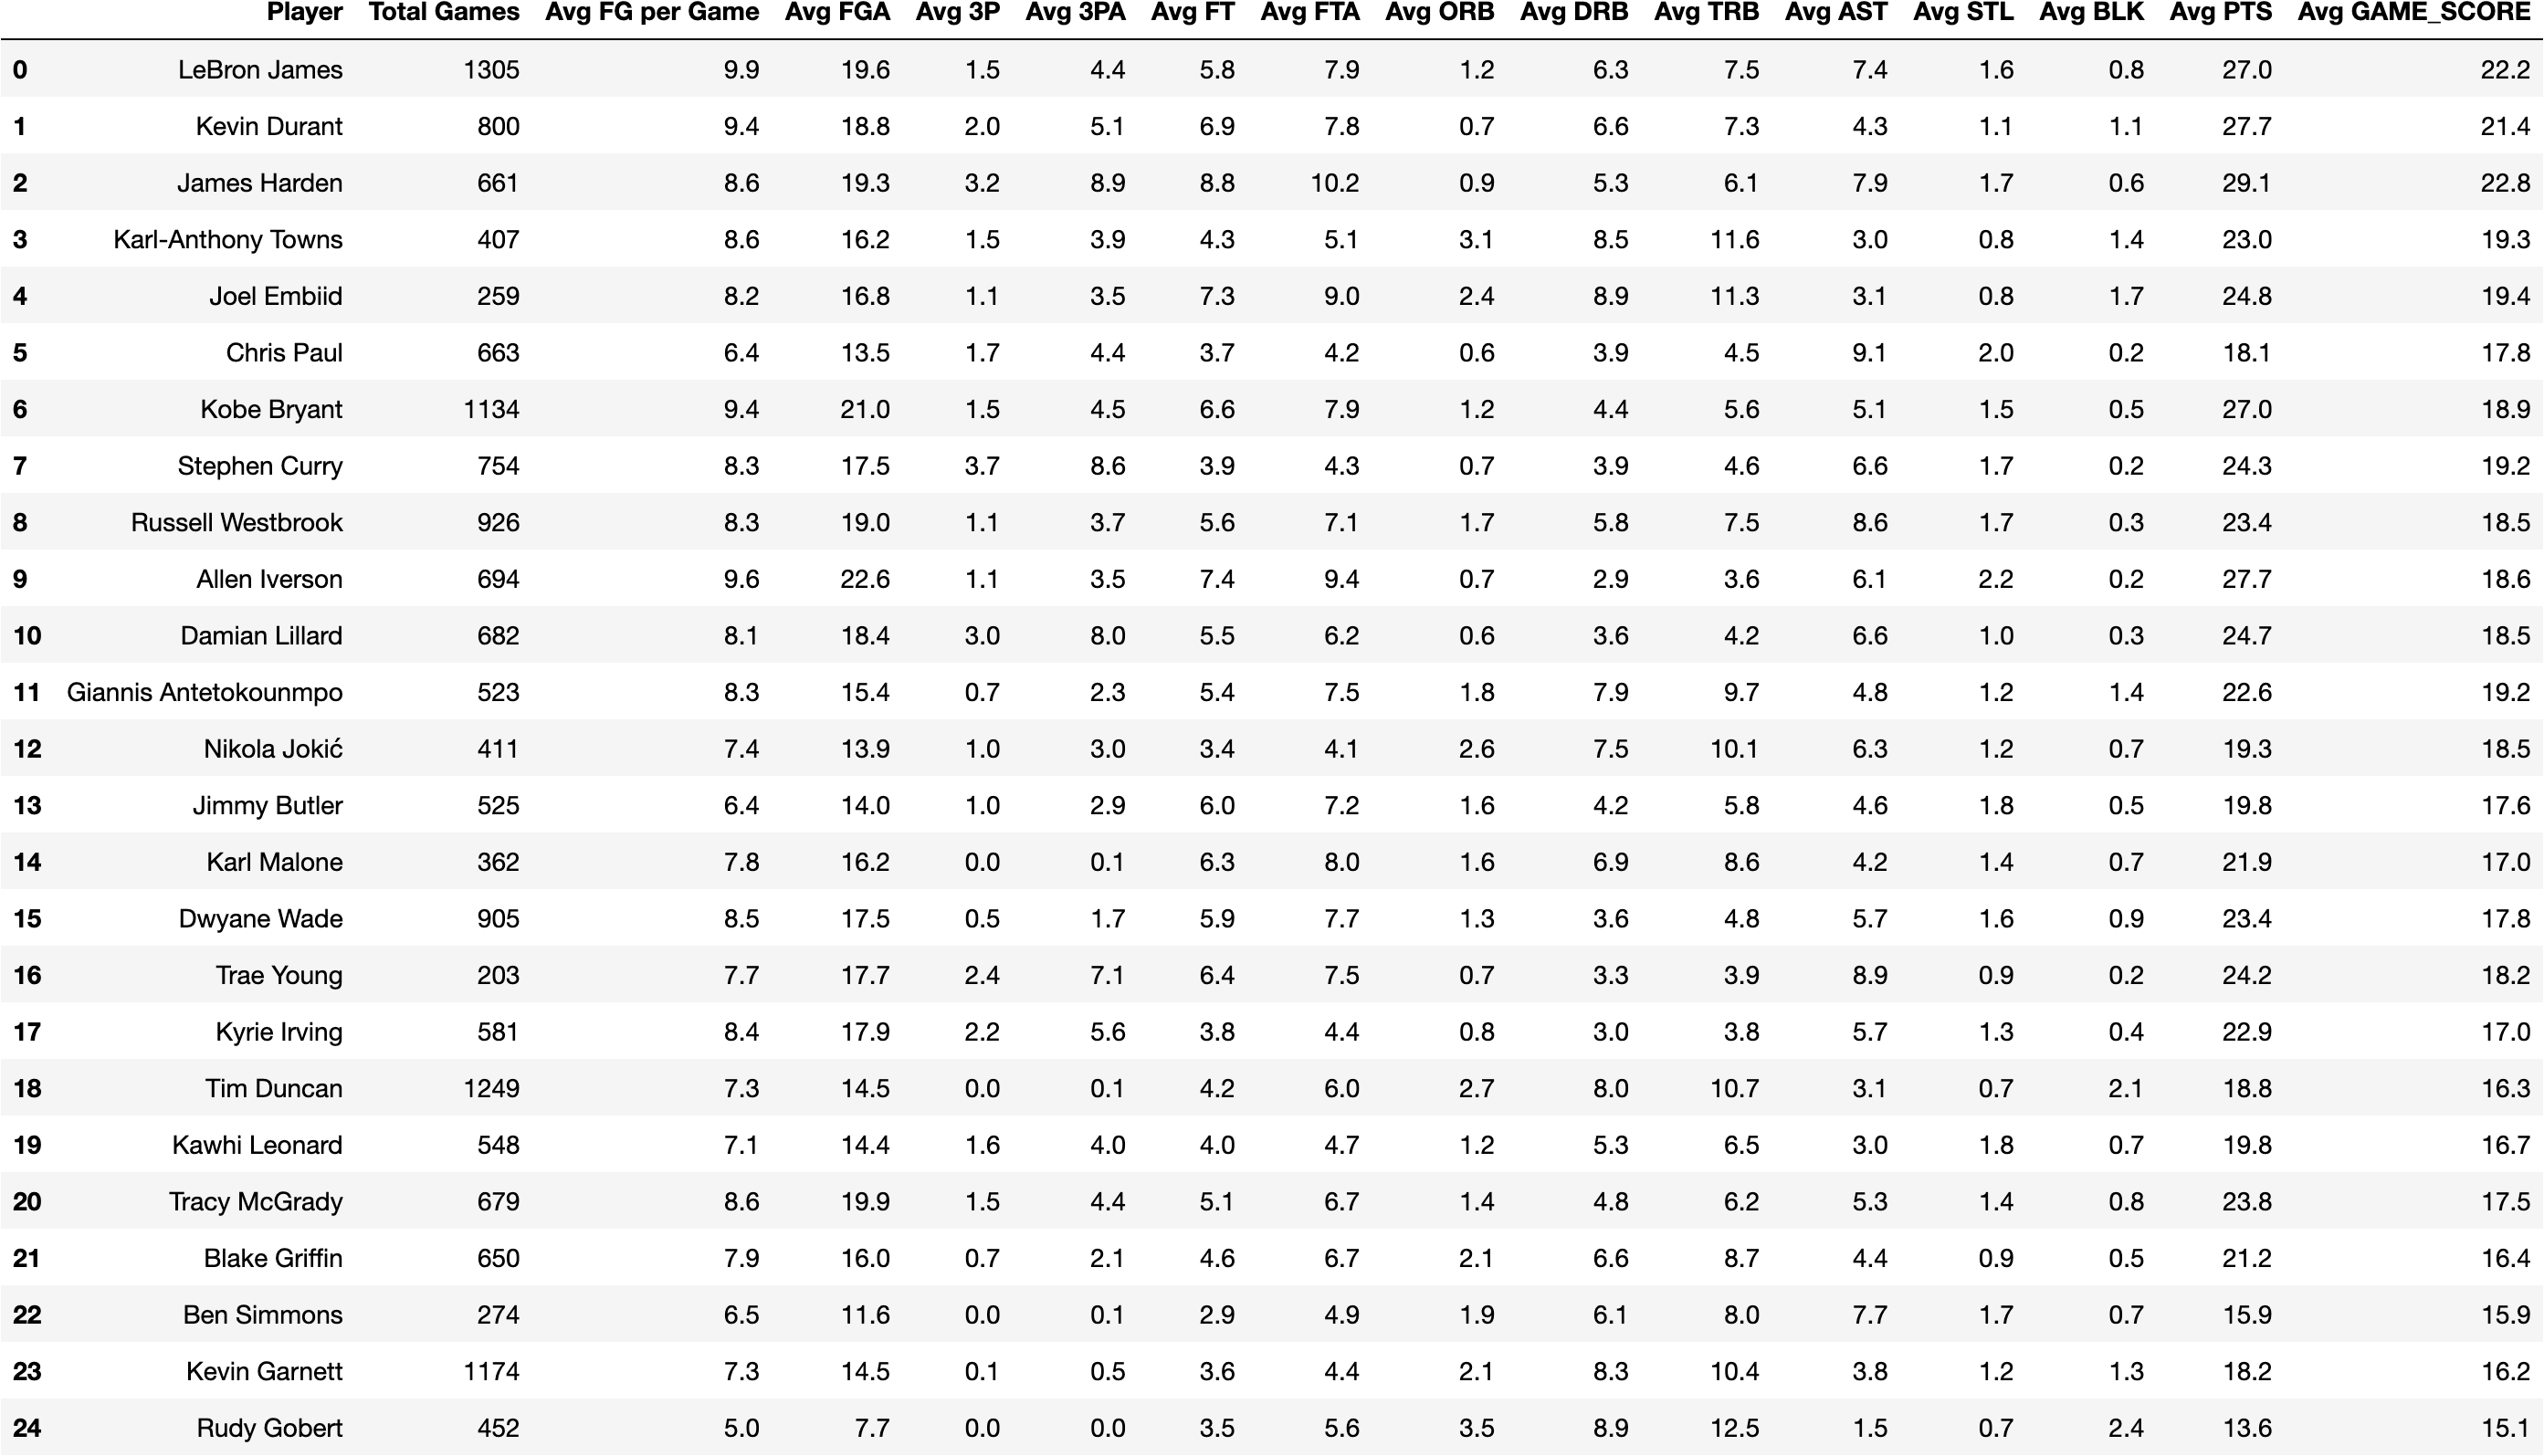
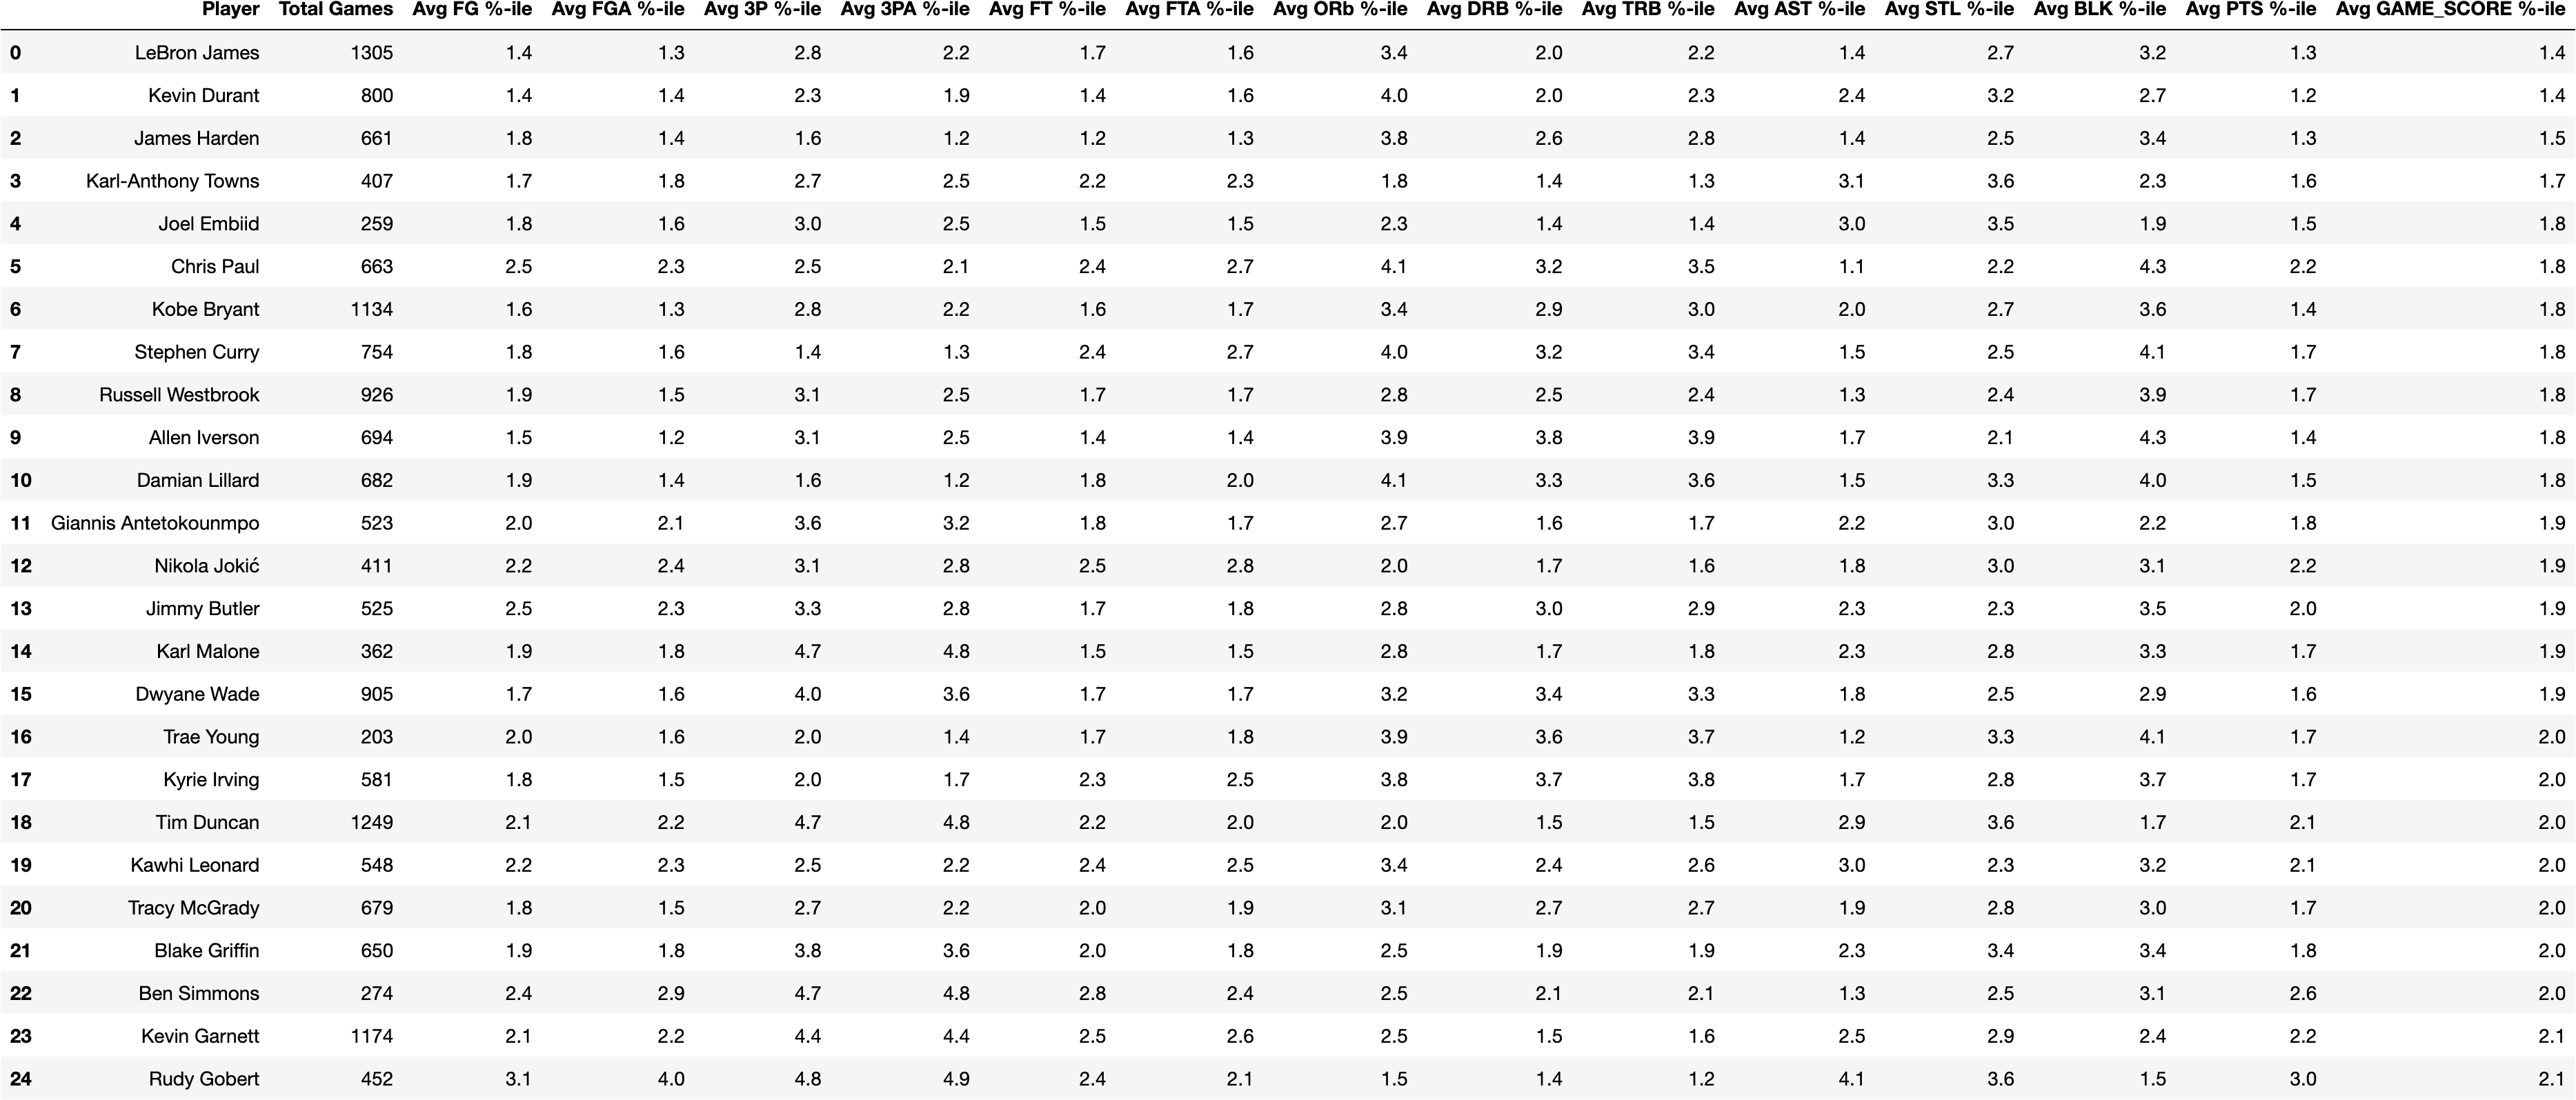
Observations: Even the most glib fans would not be surprised at the top 2 players, both perennial all-stars and both headed to the Hall of Fame: Lebron James, and Kevin Durant. LeBron James played 1,305 games from 2000-2021, during which he averaged 27 points per game with 7 assists, 7 rebounds, 2 steals and 1 block per game. Kevin Durant, whom played 800 games, took less shots per game overall, but did shoot more efficiently (Durant was top 20-30% for 3P, FT and FG, while James was slightly lower) while averaging 27 points, 7 rebounds and 4 assists. Next on the list was James Harden, who took more shots (he averaged 8.9 3P shots per game, as compared to 5.1 for Durant and 4.4 for James). At 29.1 points per game over 661 games, he ranked as the highest per-game scorer (games > 300) during the trailing 20 years.
Initial look at top 25 players, with metrics quantiled (1 = top 20%; 5 = bottom 20%):
Methodology: To standardize across the dataset, I also ranked each value and then grouped into quantiles (where 1 = top 20% of the dataset and 5 = bottom 20% of the dataset). For the purpose of finding the best players, I filtered games played to > 300.


Observations:
Another way to analyze the top players list may be to look at the cumulative +/- metric. The +/- metric keeps track of the net changes in the score when a given player is either on or off the court. In short, postive scores indicate the player adds value, whereas negatives scores indicate value destruction. This method does result in some overlap for the top players since 2000, but there are also new entrants - such as Tim Duncan and Tony Parker of the San Antonio Spurs, Klay Thompson and Draymond Green of the Golden State Warriors, and Rasheed Wallace and Chauncey Billups of the Detroit Pistons. The reason for this - the +/- metric is biased in that it does not explicitly measure an individual player's performance - the metric is impacted by the caliber of a player's teammates as well. It follows that an individual player on a better team will have a higher +/- metric by virtue of being on the court at the same time with better teammates.
The best teams of the past 2 decades include in some order the San Antonio Spurs from 2001-2016 (won 4 championships during the period); the Golden State Warriors from 2015-2021 (3 championships), and the Detroit Pistons of the early 2000s (1 championship). It's notable that each of these teams had a long duration where the core of the team maintained intact. The core of the Spurs was led by Tim Duncan, widely regarded as the best power forward ever, along with Tony Parker and Manu Ginobili, and later Kawhi Leonard; Steph Curry is head of the snake for the juggernaut Warriors and has been teammates with Draymond Green and Klay Thompson since the 2014 season; and the Detroit Pistons were unique in that the team was not led by a perennial superstar, but did succeed throguh a team approach with 4 very good players in Chauncey Billups, Rasheed Wallace, Ben Wallace and Tayshaun Prince.
This is all to say that those players that appeared on the best player list using the +/- metric and not through some form of ranking the aggregrate GAME_SCORE metric (Parker of the Spurs; Green and Thompson of the Warriors; and Billups and Wallace of the Pistons) benefitted form the quality of their teammates and the intactness of the core that formed the team.


Random Thought 2: Top 25 individual seasons since 2000:
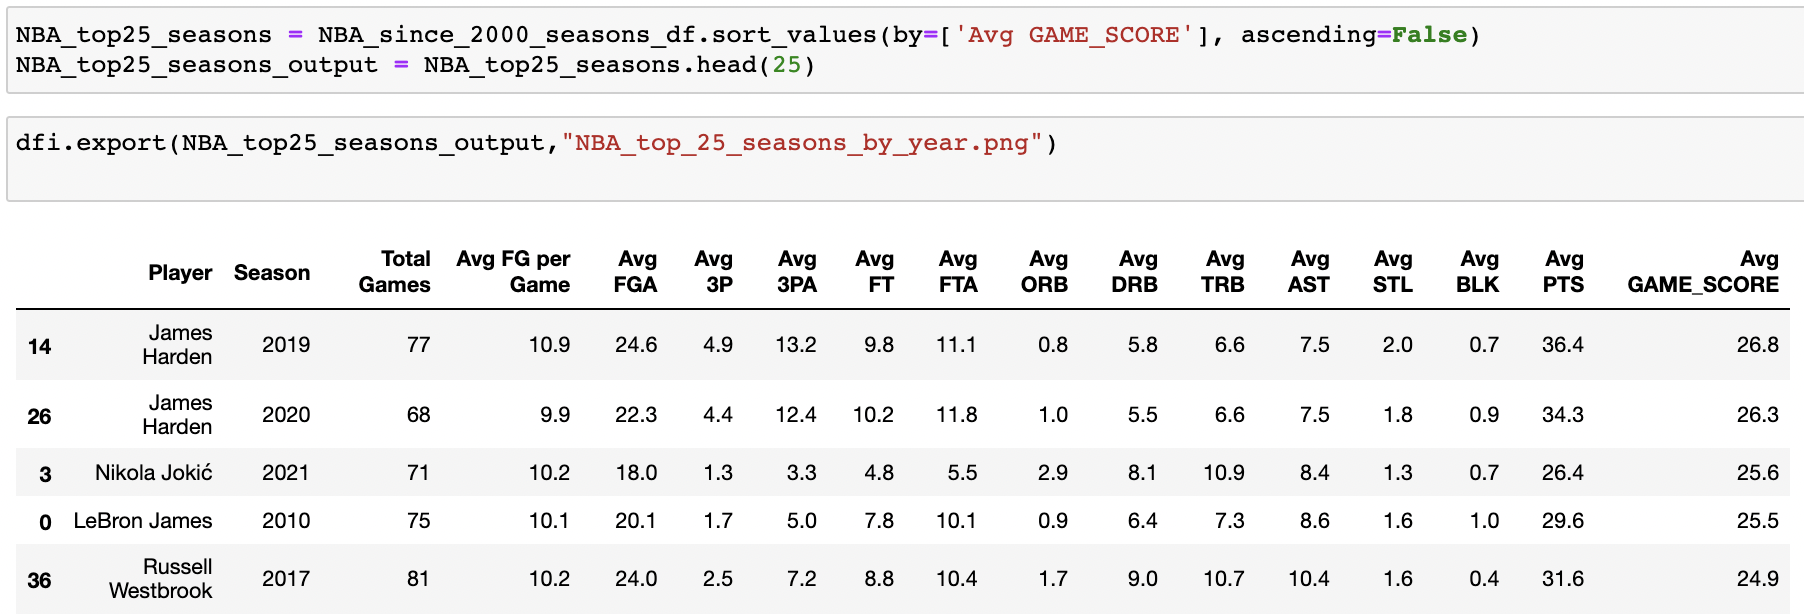
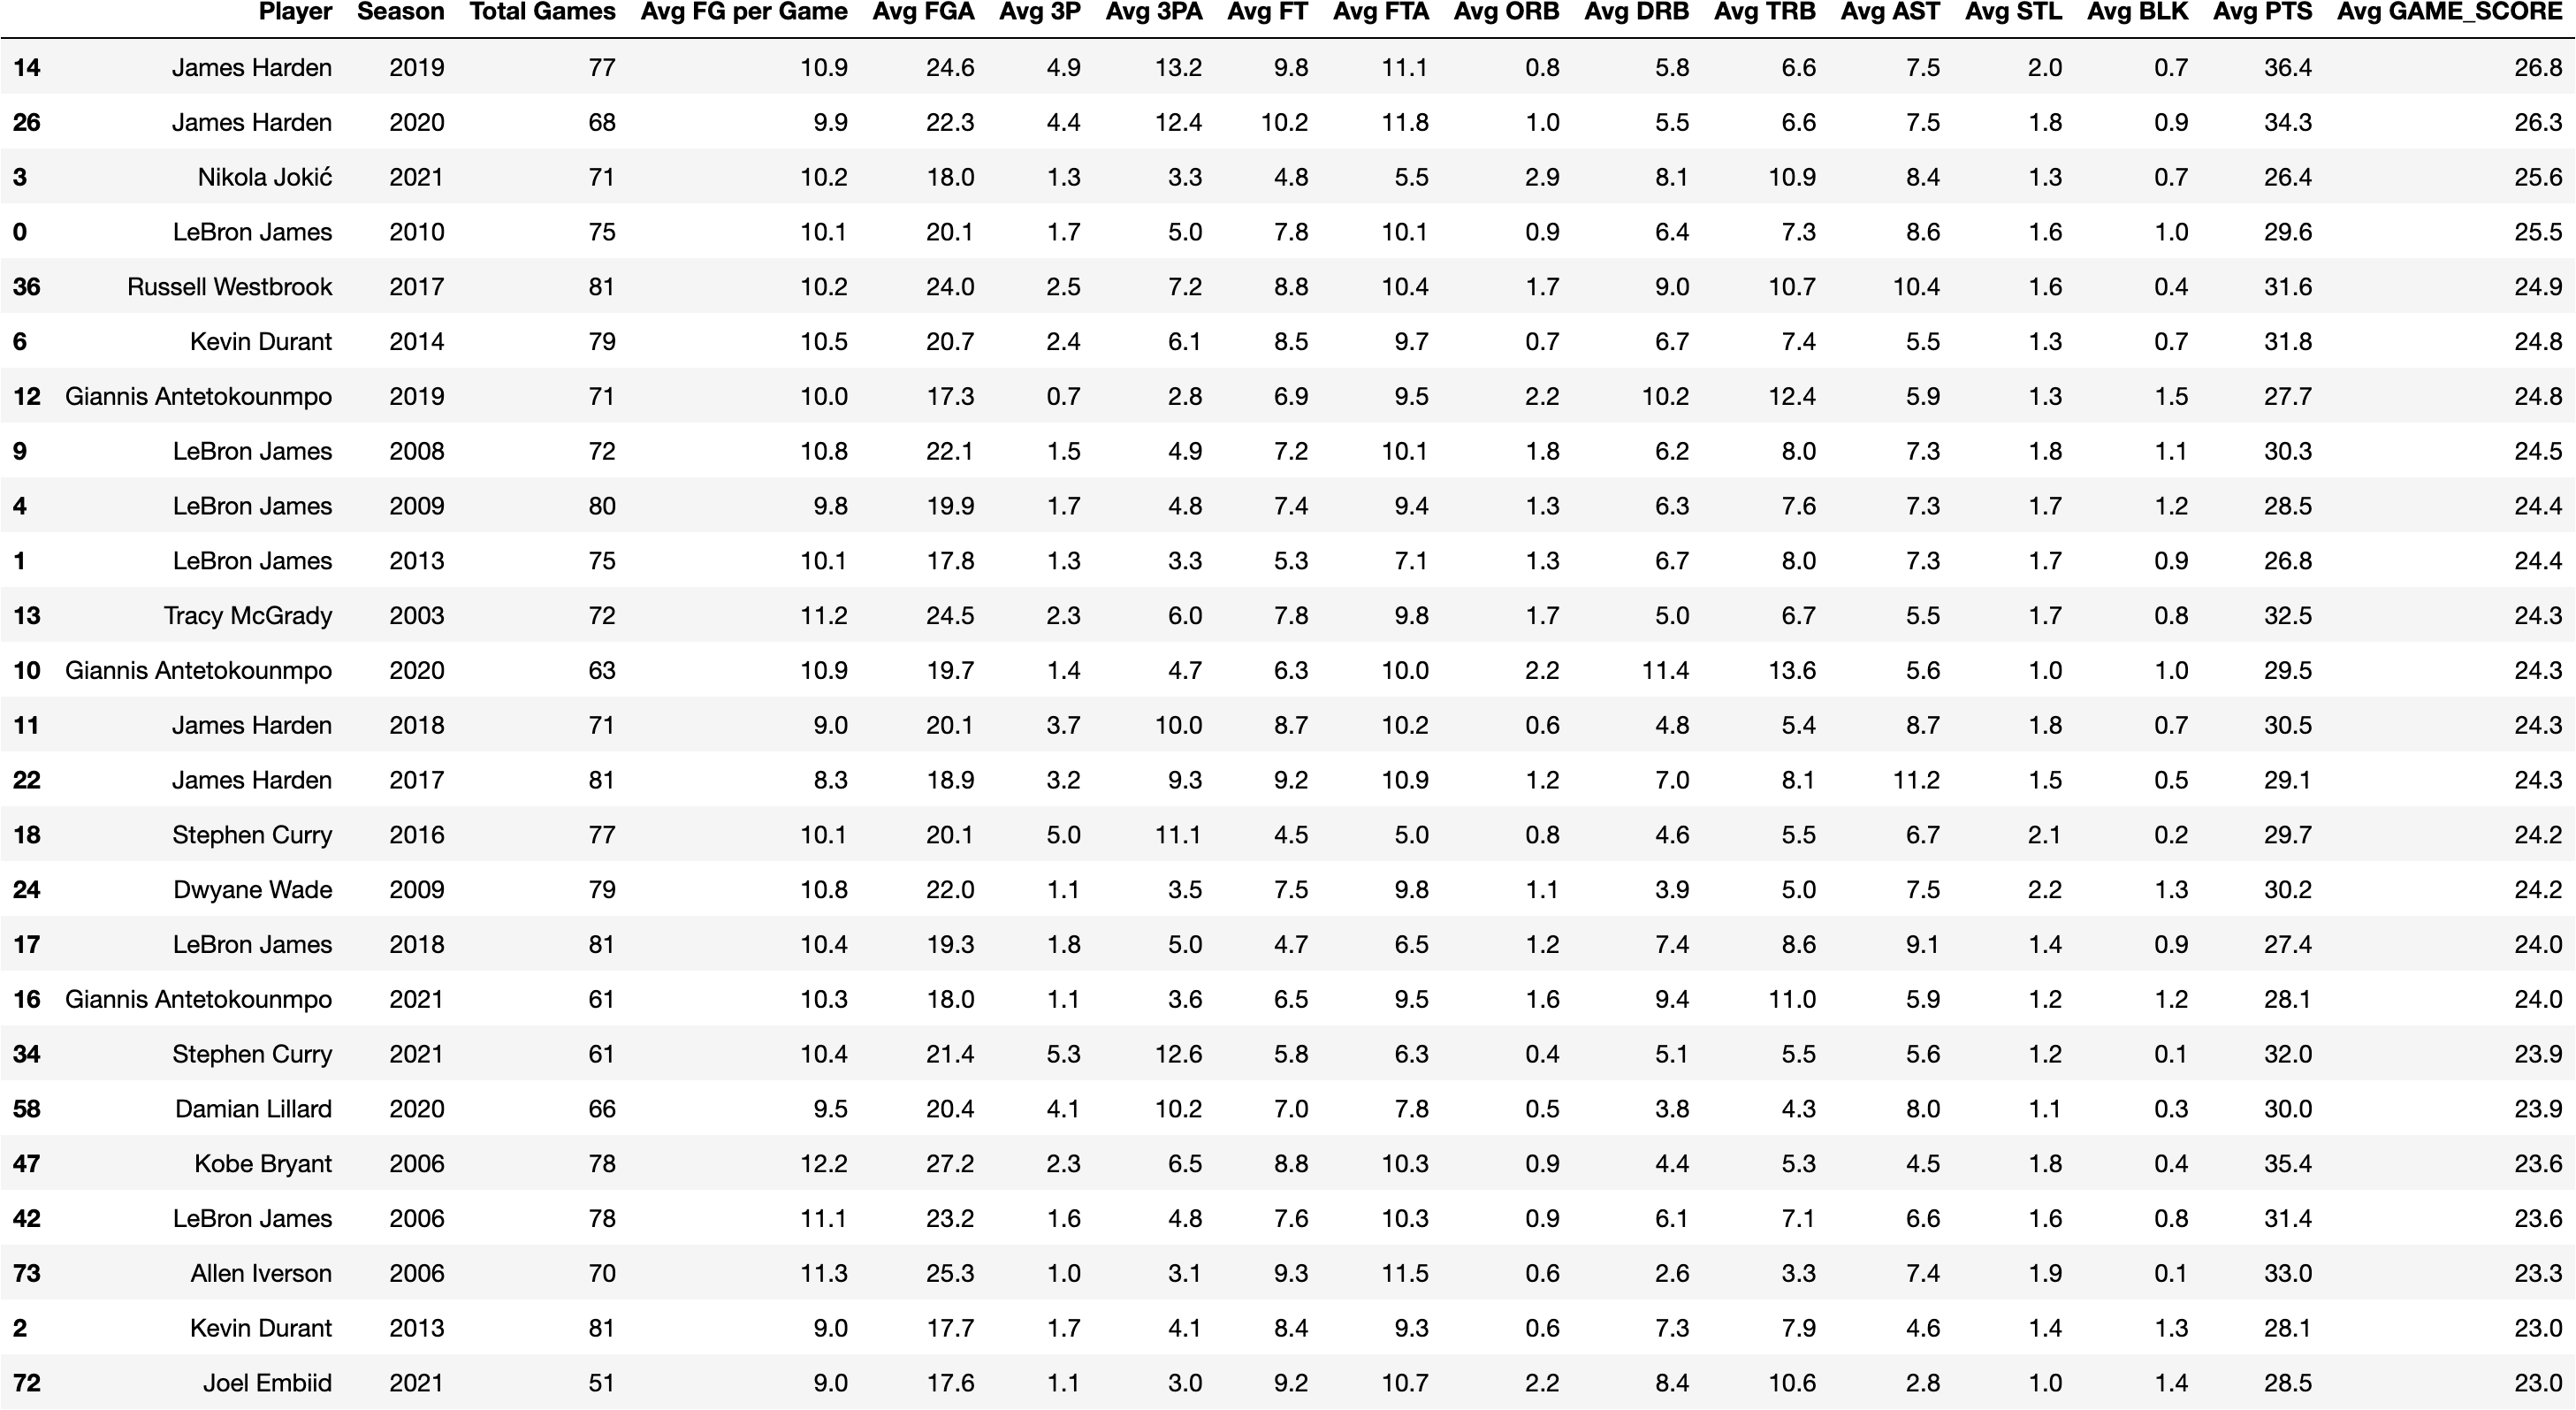
Methodology: From the original dataset (n=230,326), I used the groupby function on Season, then averaged each statistical category to arrive at per season stats, and finally ranked by highest Game_Score average.
Observations:
My first observation is that it's notable that the 3 best (offensive) individual seasons of the past 20 years occured within the past 3 years, and in my mind there is no doubt that the scoring numbers are biased upwards due to recent rule changes. The 24-second shot clock, in which a team must shoot and at least hit the basketball rim within 24 seconds of obtaining offensive possession, has been in place since 1954. Starting in the 2018-2019 season, the NBA tweaked the rules a bit so that when a team shoots and then secures an offensive rebound to start a subsequent offensive position, the shot clock is reduced from 24 seconds to 14 seconds. The effect is, with reduced time to shoot, there are more offensive possessions, and as a result offensive statistics are biased upward, both for offense but also for defense as well (although likely to a lesser extent than offense). The changes were made in part to speed up the game, but also, I'm sure, is motivated for league revenue generation purposes (reduced time to shoot -> more shots -> more chances to score -> better stats -> higher excitement and interest in the league).
James Harden of the Houston Rockets posted the two best seasons (in 2019 and 2020) but he likely benefitted from his being the primary focus of his team's offense. The higher offensive usage resulted in an increased volume of shots. In both seasons, he averaged >=10 3-point shots as well as >=10 free-throws per game. The only other instance this occurred during the past 20 years was Harden's 2018 season, which ranks as the 13th-best invididual season of the past 20 years.
Nikola Jokic of the Denver Nuggets delivered the 3rd best season of the past 20 years in 2021, during which he also won the league MVP. Jokic did so while averaging 26 points, 8 rebounds, and 11 assists - which as a towering center, is unique to average that many assists per game. During that season, the 6'11 Serbian-born center dished out the 3rd most assists per game; the remaining 4 players in the top 5 assists per game leaderboard that season were 6" point guards. He is widely regarded as the best passing big man of all time.
Finally, LeBron James appears several times on the best 25 seasons of the past 20 years list. This should surprise no one - James is regarded as one of the top 2 players of all time (the other player is icon Micheal Jordan). Although they played in a different era governed by slightly different rules, James' longevity (he is currently on his 19th season) and his all around game will likely push him over the top as the best basketball player of all time. In fact:
- James is the only player in NBA history to record at least 35,000 career points, 9,000 rebounds, and 9,000 assists; no other player has at least 27,000 points, 8,000 rebounds, and 8,000 assists.
- James is the only player in NBA history to post at least 2,000 points, 500 rebounds, 500 assists, and 100 steals in four consecutive seasons...
- ...and is the only player in NBA history to post at least 2,000 points, 500 rebounds, 500 assists, and 100 steals in a single season for at least eight seasons.
- James is the only player in NBA history to be in the top 5 all-time in points and top 10 all-time in assists.
- He is the only player in NBA history to average at least 25 points per game for 17 consecutive seasons, and the only player in NBA history to score 10 points or more in 1,000 consecutive games.
- Finally, he is one of the two players in NBA history to win four NBA Most Valuable Player Awards in a span of five years - the other is NBA legend Bill Russell (winner of 11 championships in 13 seasons).

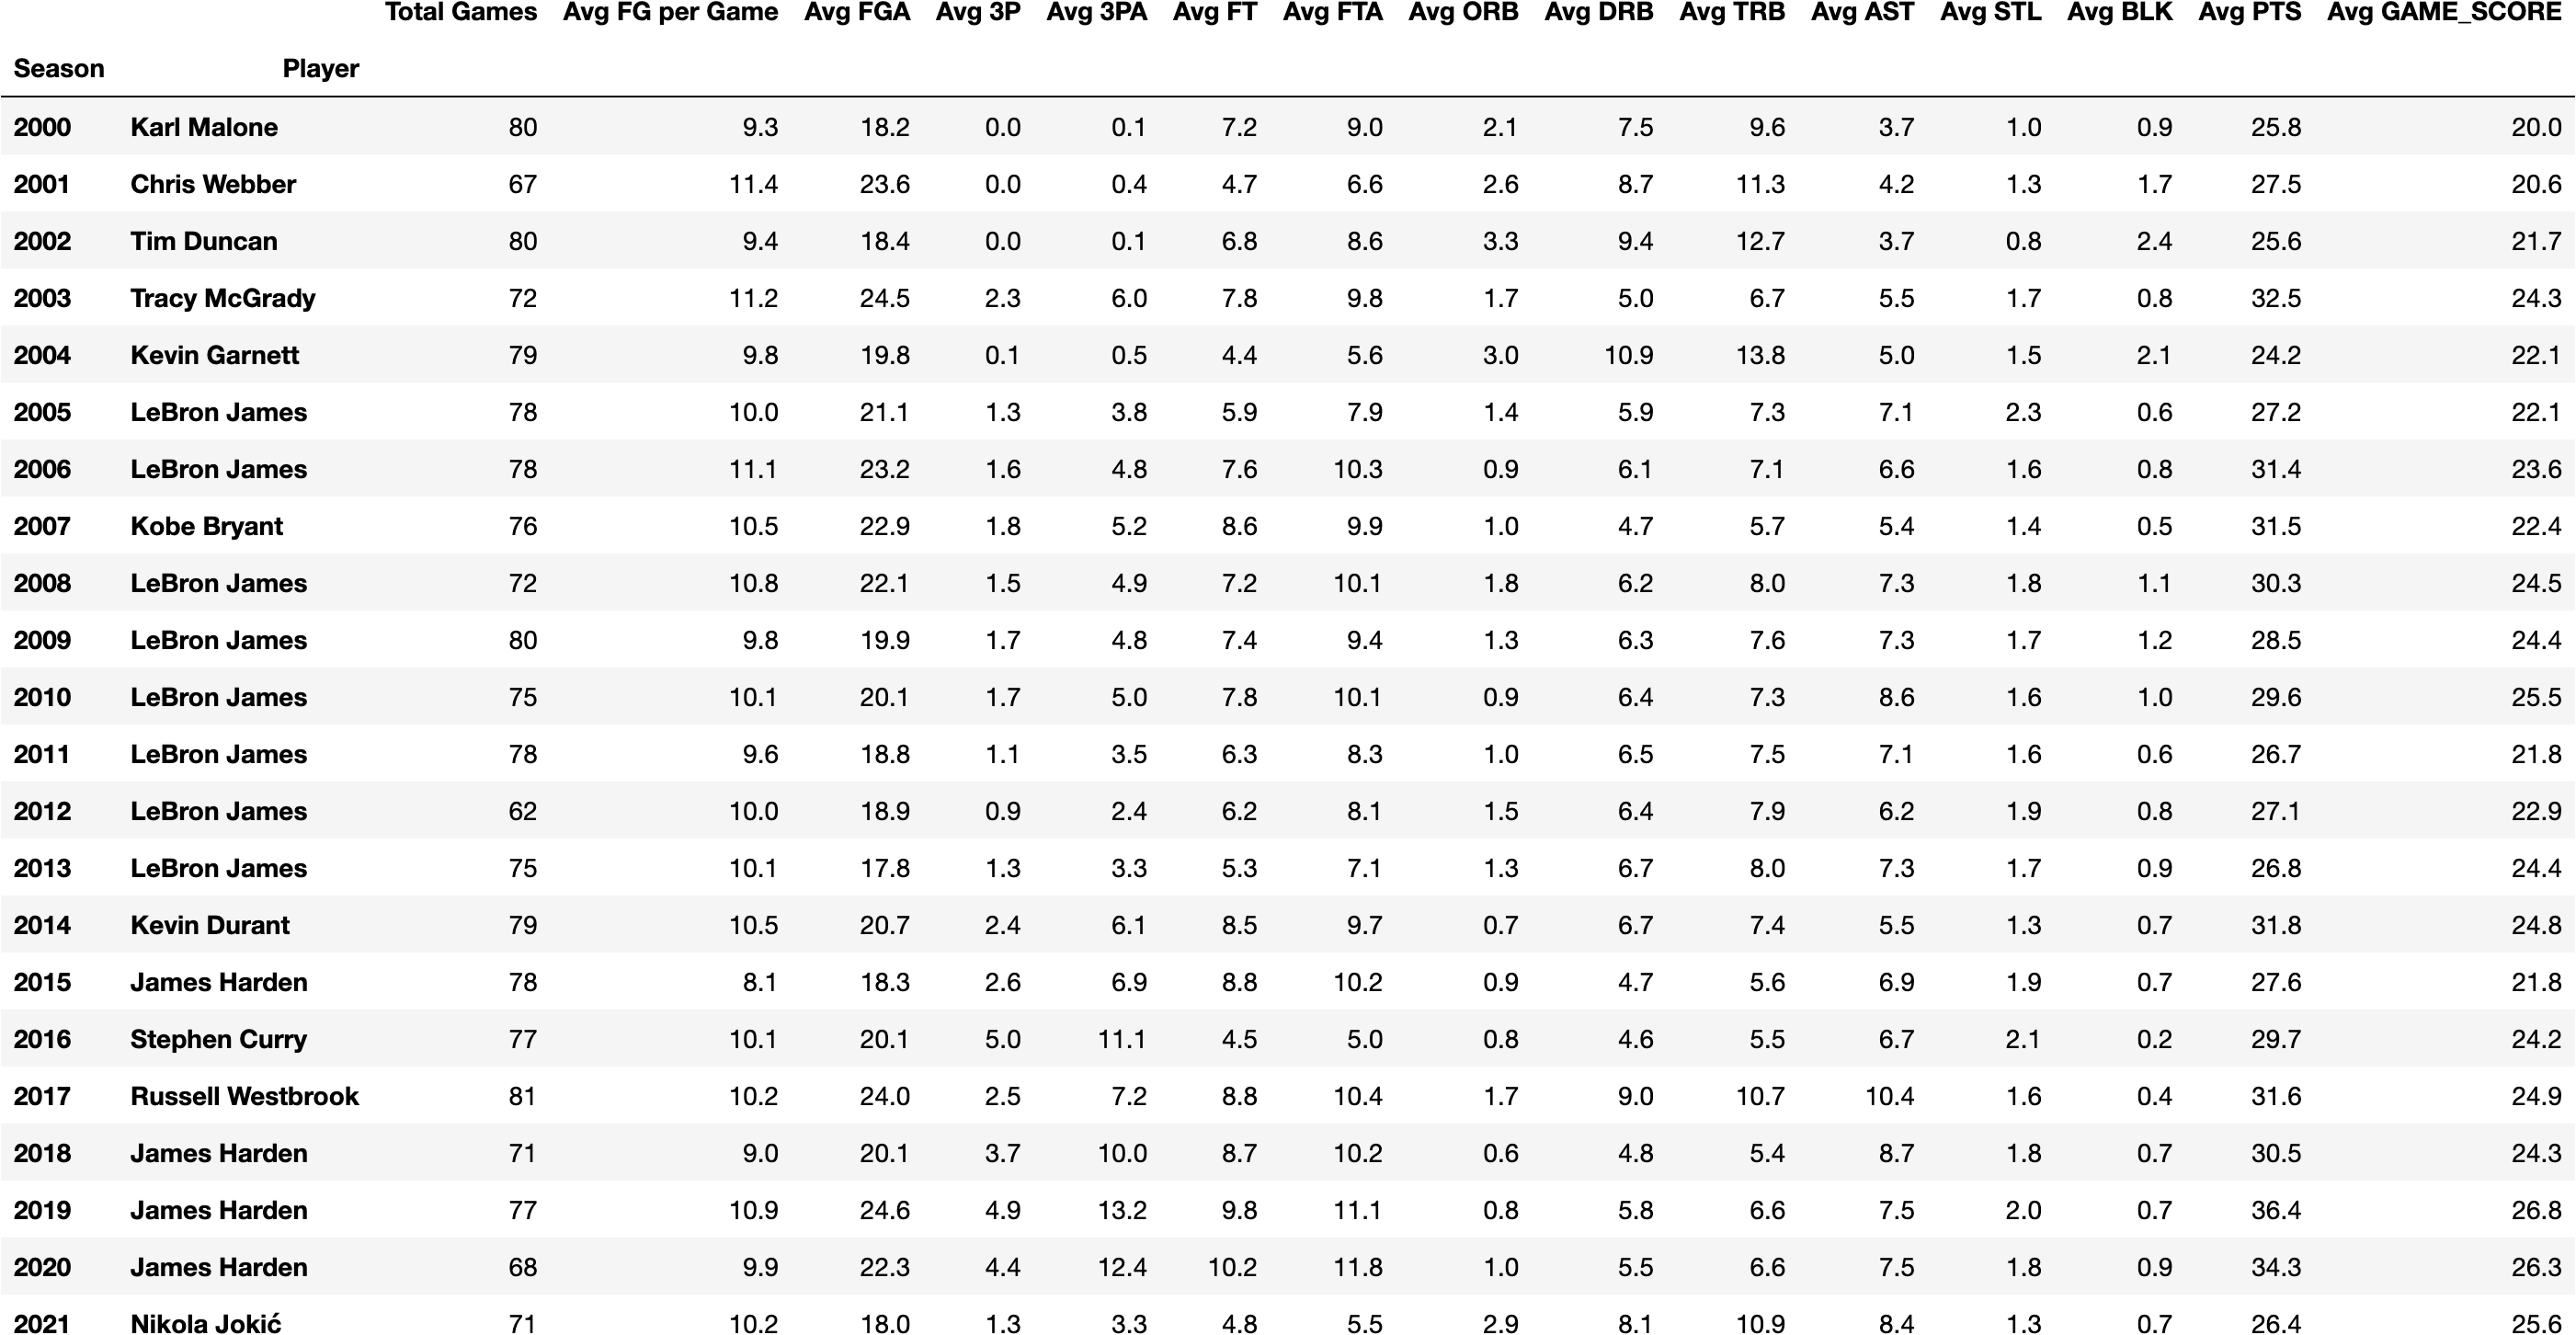
Random Thought 3: The best player for each season, from 2000-2021
Observations: To be considered the best player per season, a player would have to average a minimum of 24 points per game, and pull down 6 rebounds while dishing out a minimum of 4 assists. Out of 230,326 player games played, this statline was achieved 4,239 times, or 1.8%. I should also point out the the best player per season averaged well north of 24 points per game, and that while Kevin Garnett did average the lowest points per game of the beast seasons of the past 20 years, he also averaged 14 rebounds, 5 assists and 2 blocks (in the 2004 season). Out of all games played since 2000, 261 players had games with > 24 points, > 14 rebounds and > 5 assists (0.1% of all games played).


Random Thought 4: How many Triple-Doubles have been recorded since 2000?
A 'triple double' in basketball is a statistical occurrence during which a player records >=10 in any three of the offensive statistical measures during a single game. As an example, the most common form of a triple-double is when an individual player tallies 10 or more points, 10 or more rebounds, and 10 or more assists for one game (the name refers to three stat categories in double digits). Some pundits regard it as a sign of basketball excellence, while others regard it as merely an outcome of stat-padding; the true meaning is likely somewhere in between. Triple-doubles historically have been rare, but have increased in prominence with the increased popularity of the three-point shot and increased pace of the game (higher ending game scores are indicative of more offensive possessions).
Since 2000, there has been a total of 1,090 triple-doubles tallied by NBA players. This includes 1,076 triple-doubles of the point-rebounds-assists variety, with 13 composed of point-rebounds-blocks, and 1 including rebounds, assists and steals.

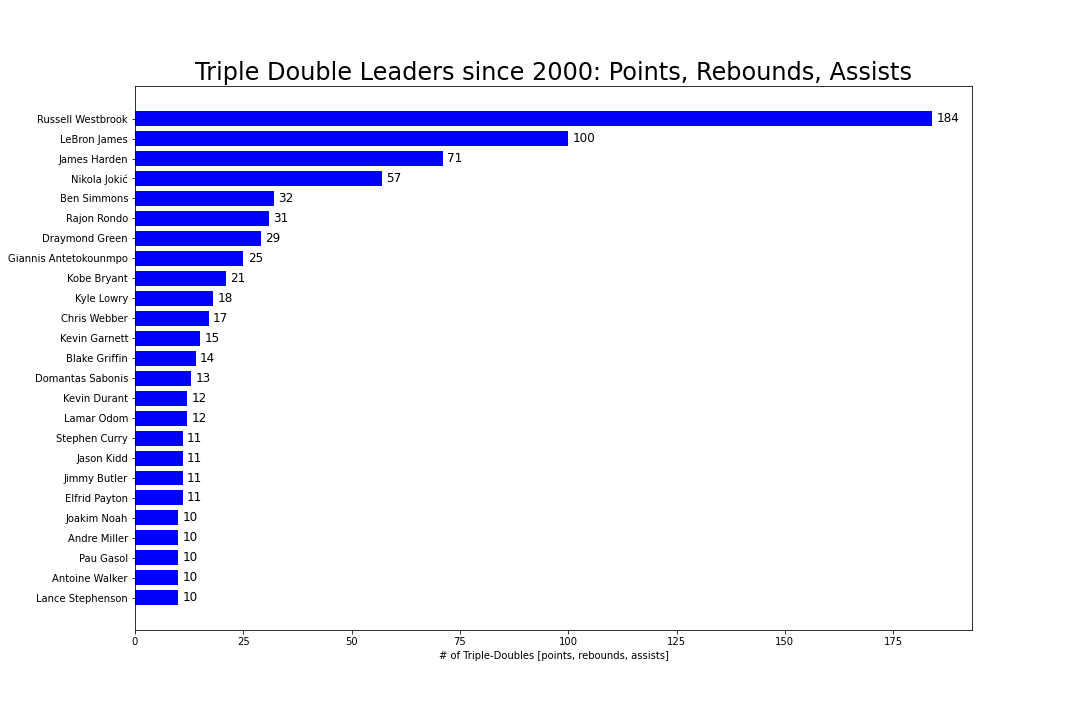

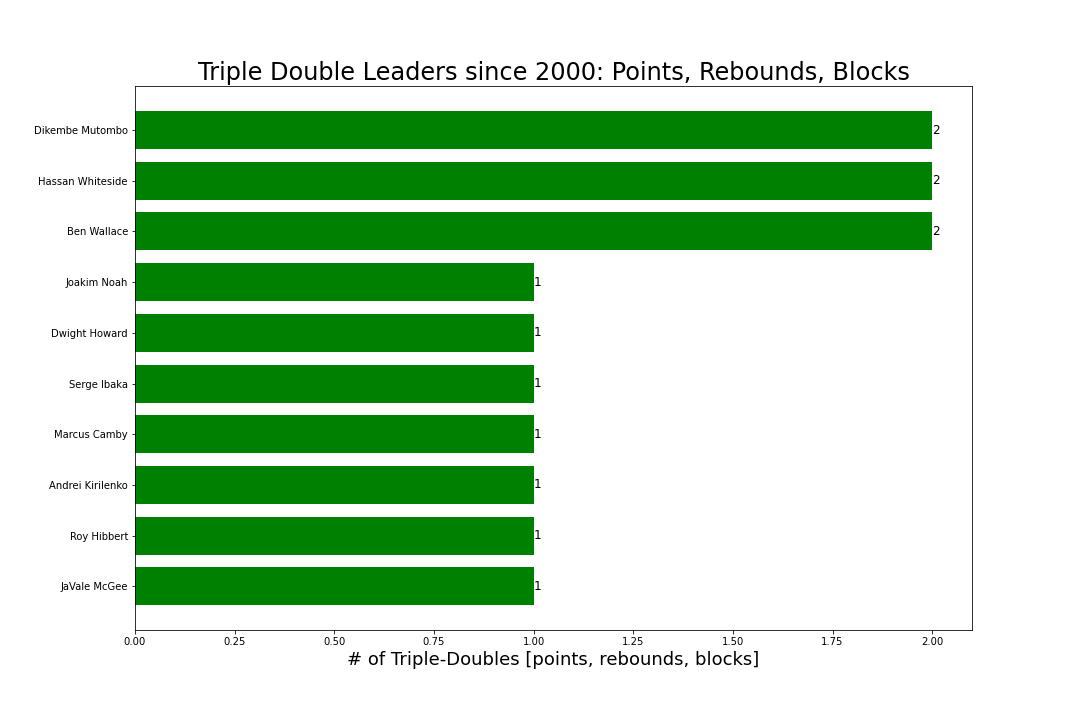
Possibly the most unique stat-line in NBA history (or at least since 2000): on February 10, 2017, Draymond Green of the Golden State Warriors recorded the first triple-double in NBA history without scoring double-digits in points.

Analysis using SQL:

Random Thought 5: Once considered a majority-American sport, basketball is played in all parts of the world and the NBA is increasingly globally diverse
The 1992 Olympics held in Barcelona, Spain marked the first time that American NBA players participated in the Olympics. And it showed, as the team, featuring Michael Jordan, Magic Johnson, Larry Bird and Charles Barkley, beat opponents by an average margin of 44 points on their way to taking home the gold medal. But the world has caught up since then, considerably, to the extent that the past 3 players awarded league MVP have been non-American.
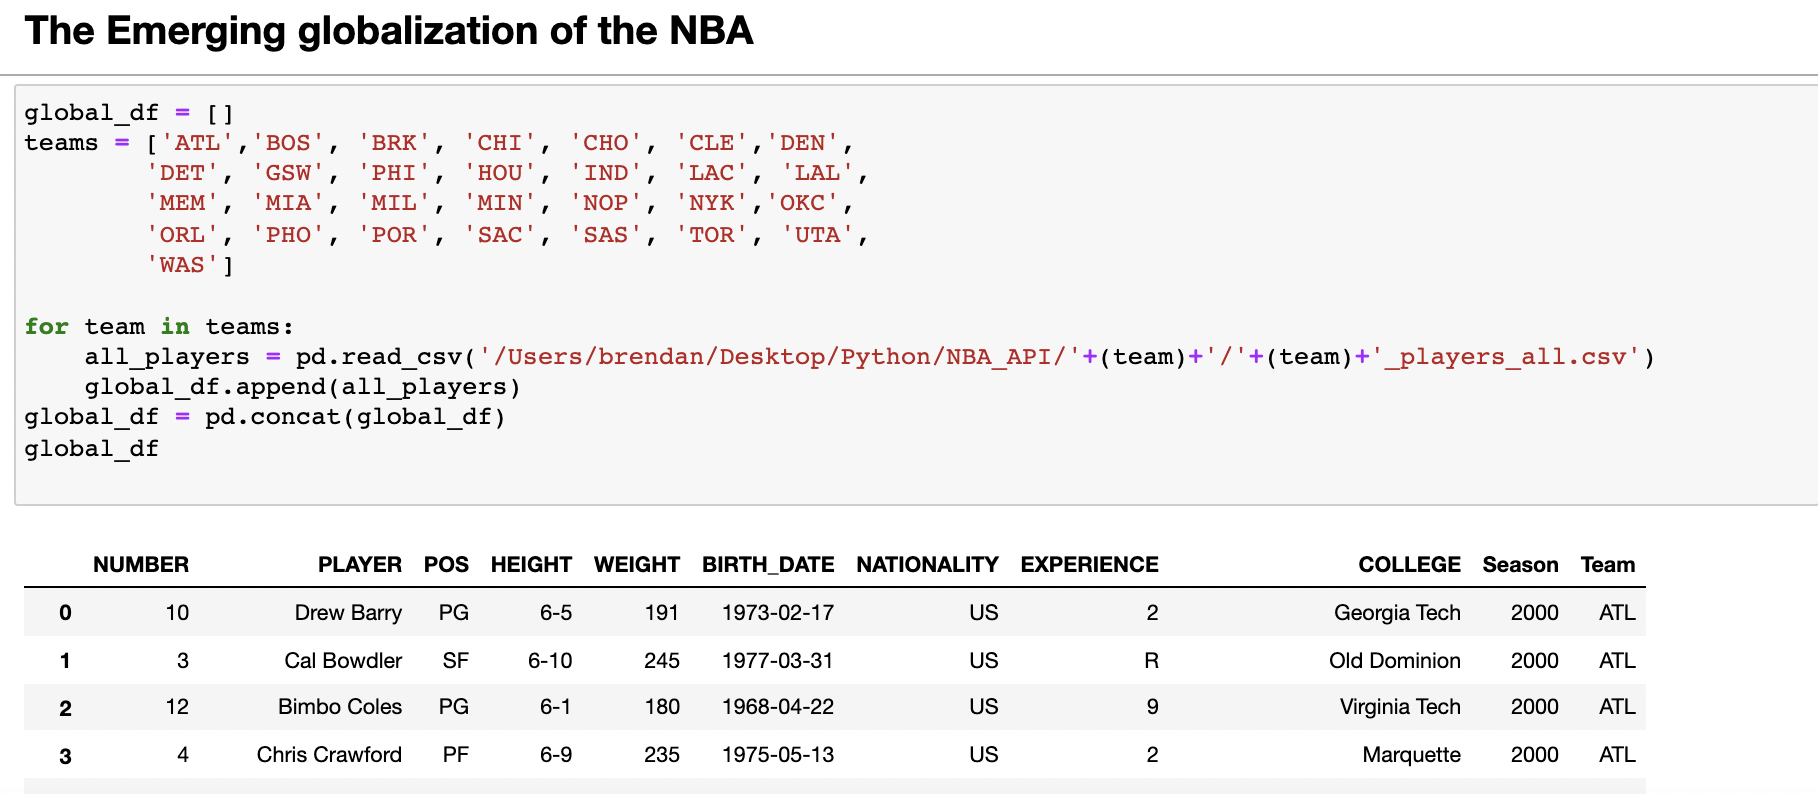
As shown below, international players represented ~23% of NBA rosters for the 2021 season (American players were 77%), which has been a steady mix shift since 2000, when 9 out of 10 players were American. In the 2021 season, American players hailed from 46 different countries, which is more than double the amount of countries represented in the 2000 season.



Random Thought 6: The 3-Point shot and the brilliance of Stephen Curry
Chris Ford of the Boston Celtics made the NBA's first 3-pointer in the 1979-1980 NBA season (the rookie seasons for both Larry Bird and Magic Johnson) and since then the shot has become a staple of the game. Originally introduced on a one-year trial basis, the 3-point line measured 22-feet from the hoop in the corners and 23-feet, 9 inches to the top of the arc. As the game has evolved, the importance of the 3-point shot has increased.
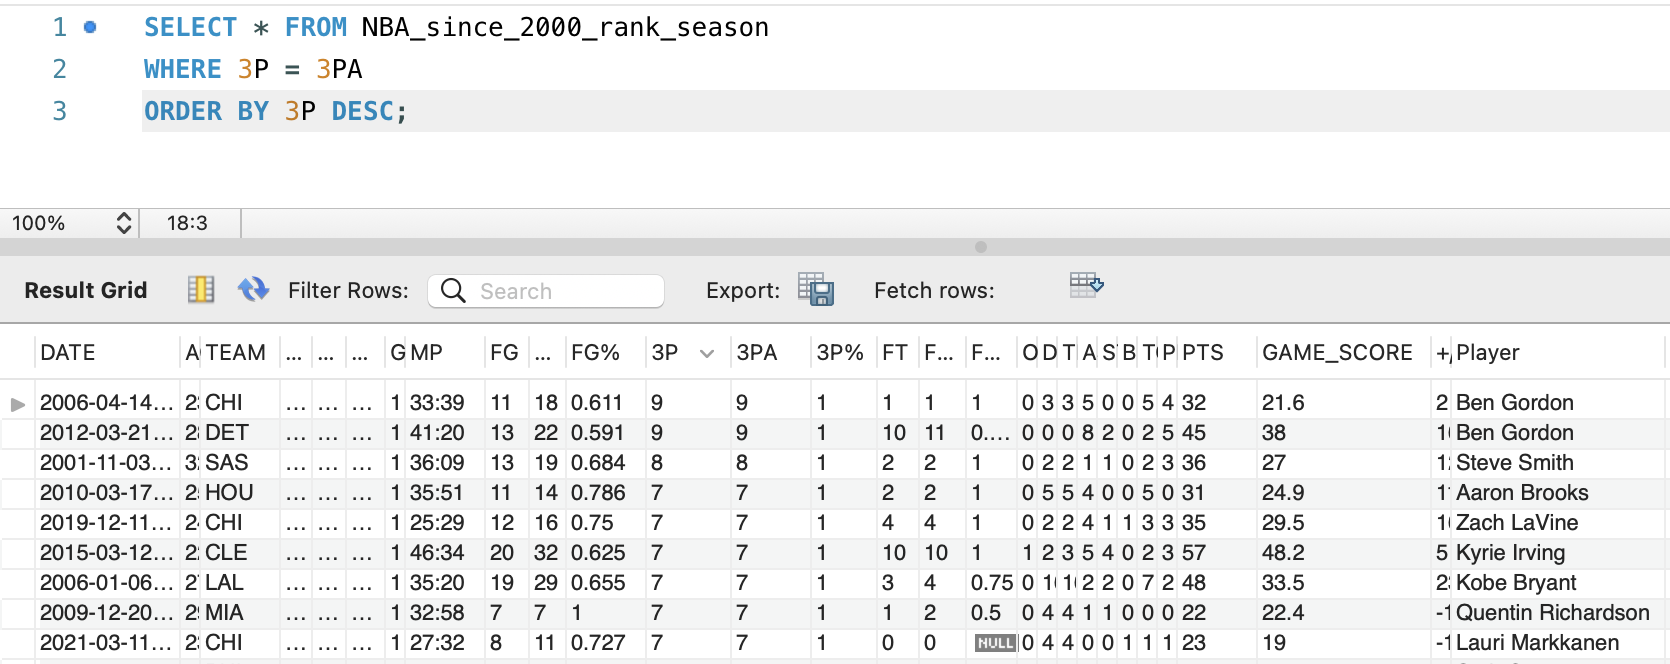
The record for most 3-point shots made without a miss during a game is held by Ben Gordon, who made 9 3-pointers in a single game (twice) without a miss. While playing for the Chicago Bulls, Ben Gordon was 9 for 9 on 3-point shots on his way to 32 points (he connected on 11 shots out of a total of 19) on April 14, 2006. A bit under 6 years later (March 21, 2012), this time as a member of the Detroit Pistons, he connected on 9 3-pointers and made 13 out of 22 shots and 10 of 11 free throws to score a total of 45 points.
But really, Stephen ("Steph") Curry of the Golden State Warriors is the 3-point king and his dominance at making the shot is widely credited for influencing a next step in the game's evolution. To wit, there has only been 3 seasons in NBA history where a player have averaged over 5 threes made per game, and all 3 belong to Steph Curry. He averaged 5.3 threes per game in the 2020-21 season, 5.1 in the 2018-19 season, and 5.1 in the 2015-16 season. As of writing, through 15 games of the 2021-22 season, he has averaged 5.7 threes made per game.
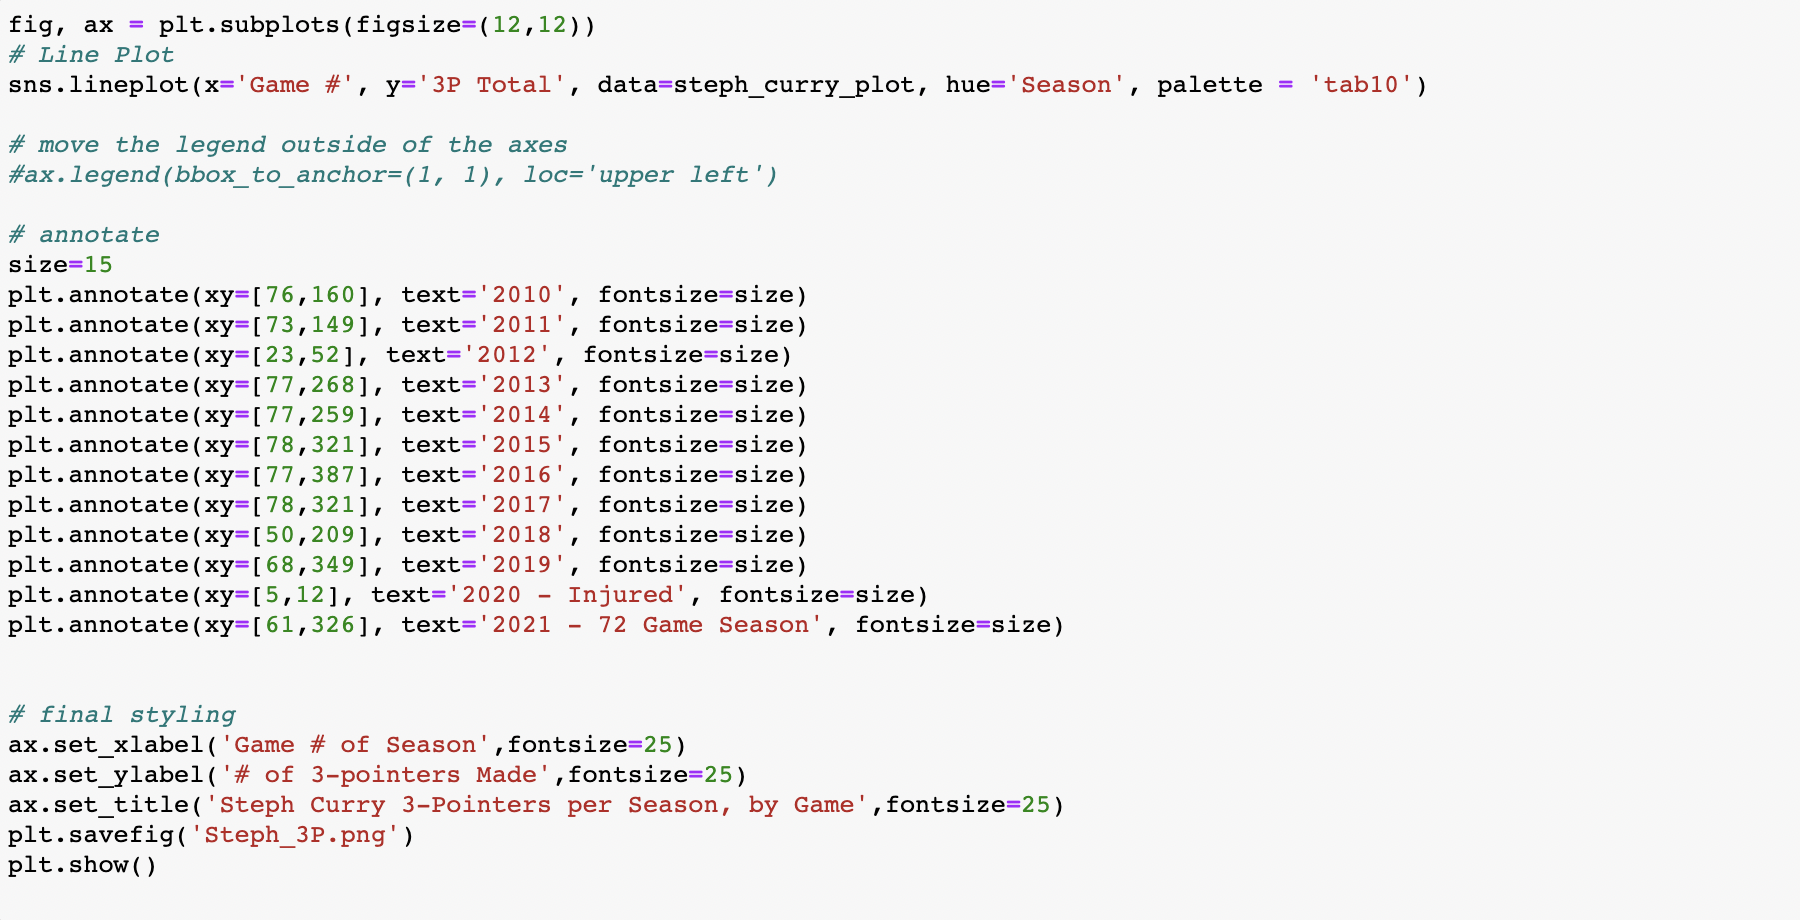
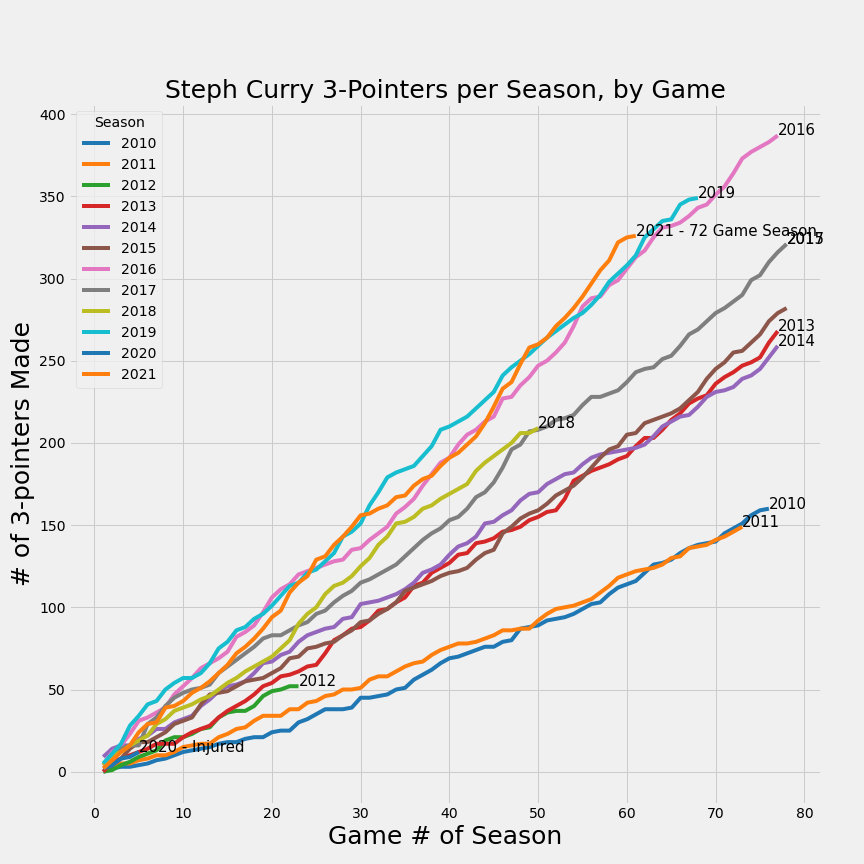
An interactive version with tooltips - made using the python package Altair - can be accessed here. Code is reproduced below.
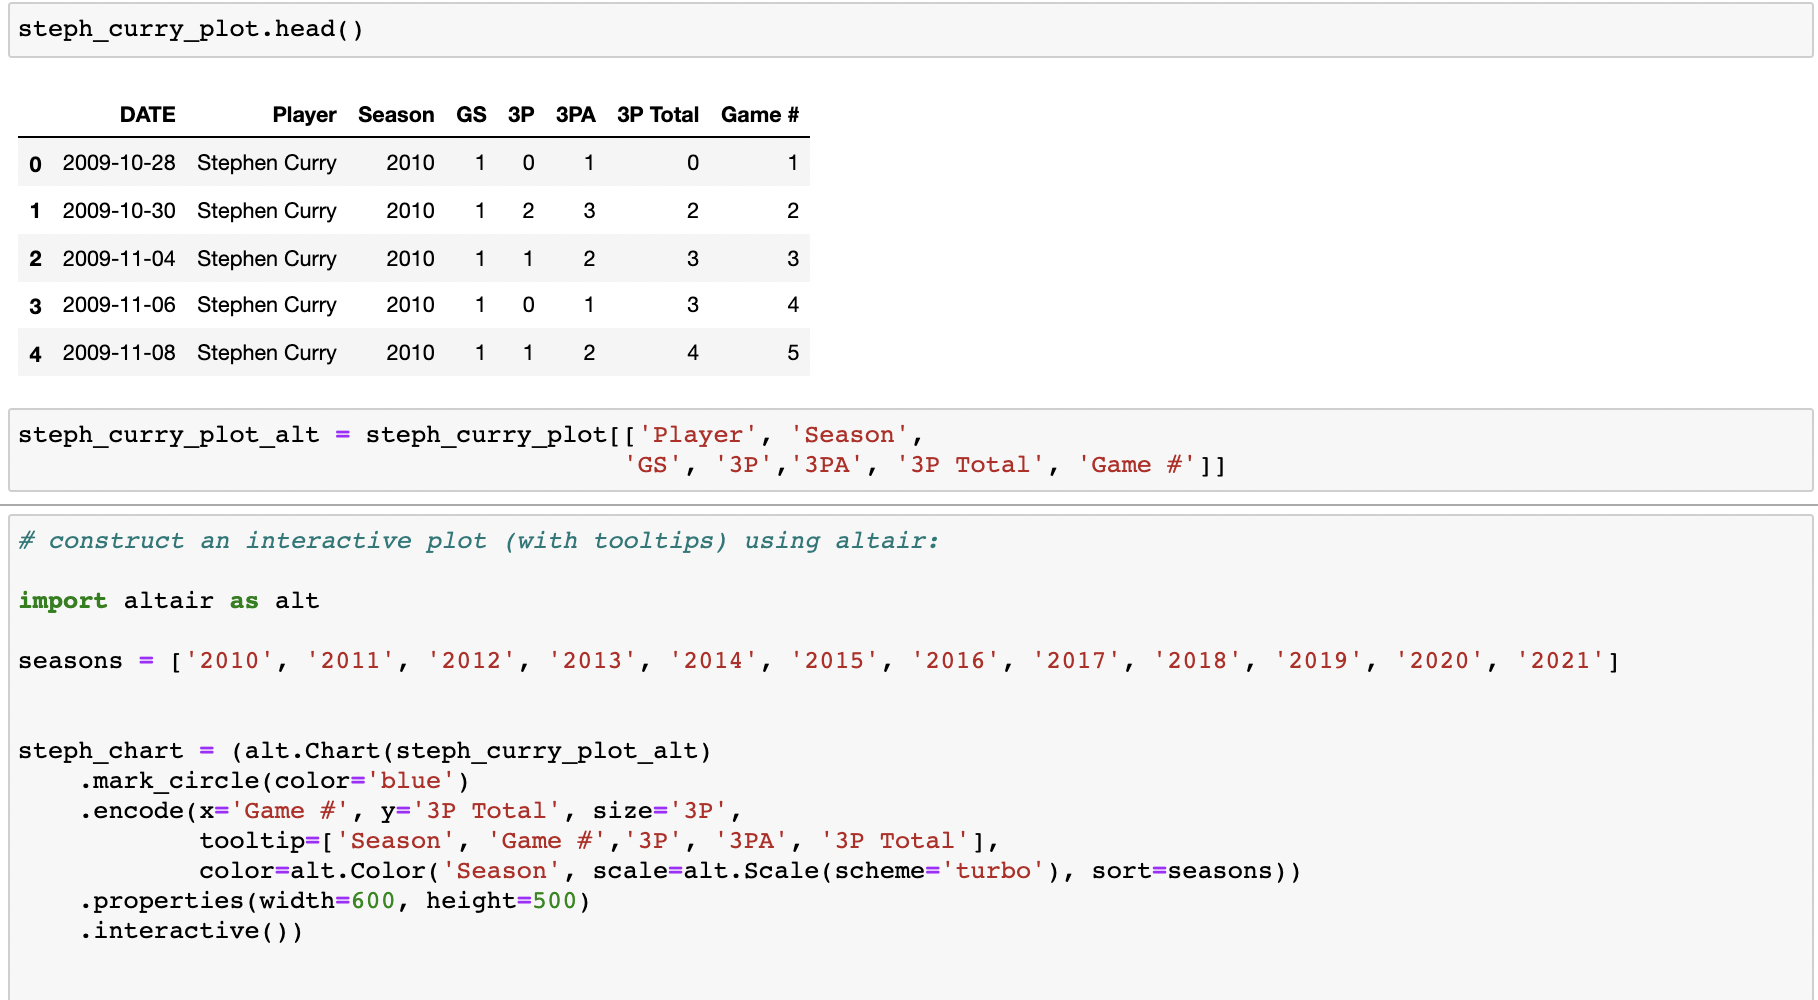

Appendix: How did I get all the data? I created my own data set
First, I used an API, web scraping, and Pandas to get all game-logs from each player for each team since the 2000 season
Much of my data collection relied on data from the excellent Basketball Reference website, which has compiled statistics for seemingly every NBA game and NBA player that has ever played (and even data on the defunct ABA league). Using a combo of web scraping and calling APIs, for each of the 30 franchises in the NBA, I created a Jupyter workbook that pulled in the game log (an individual player's stats during a game) of each player for each of the 82 games played since 2000. With 12 players per team, 82 games played per year, 30 teams and 20 seasons, this implies a total dataset of ~590,400 records (12*82*30*20), although there is likely statistical noise involved.
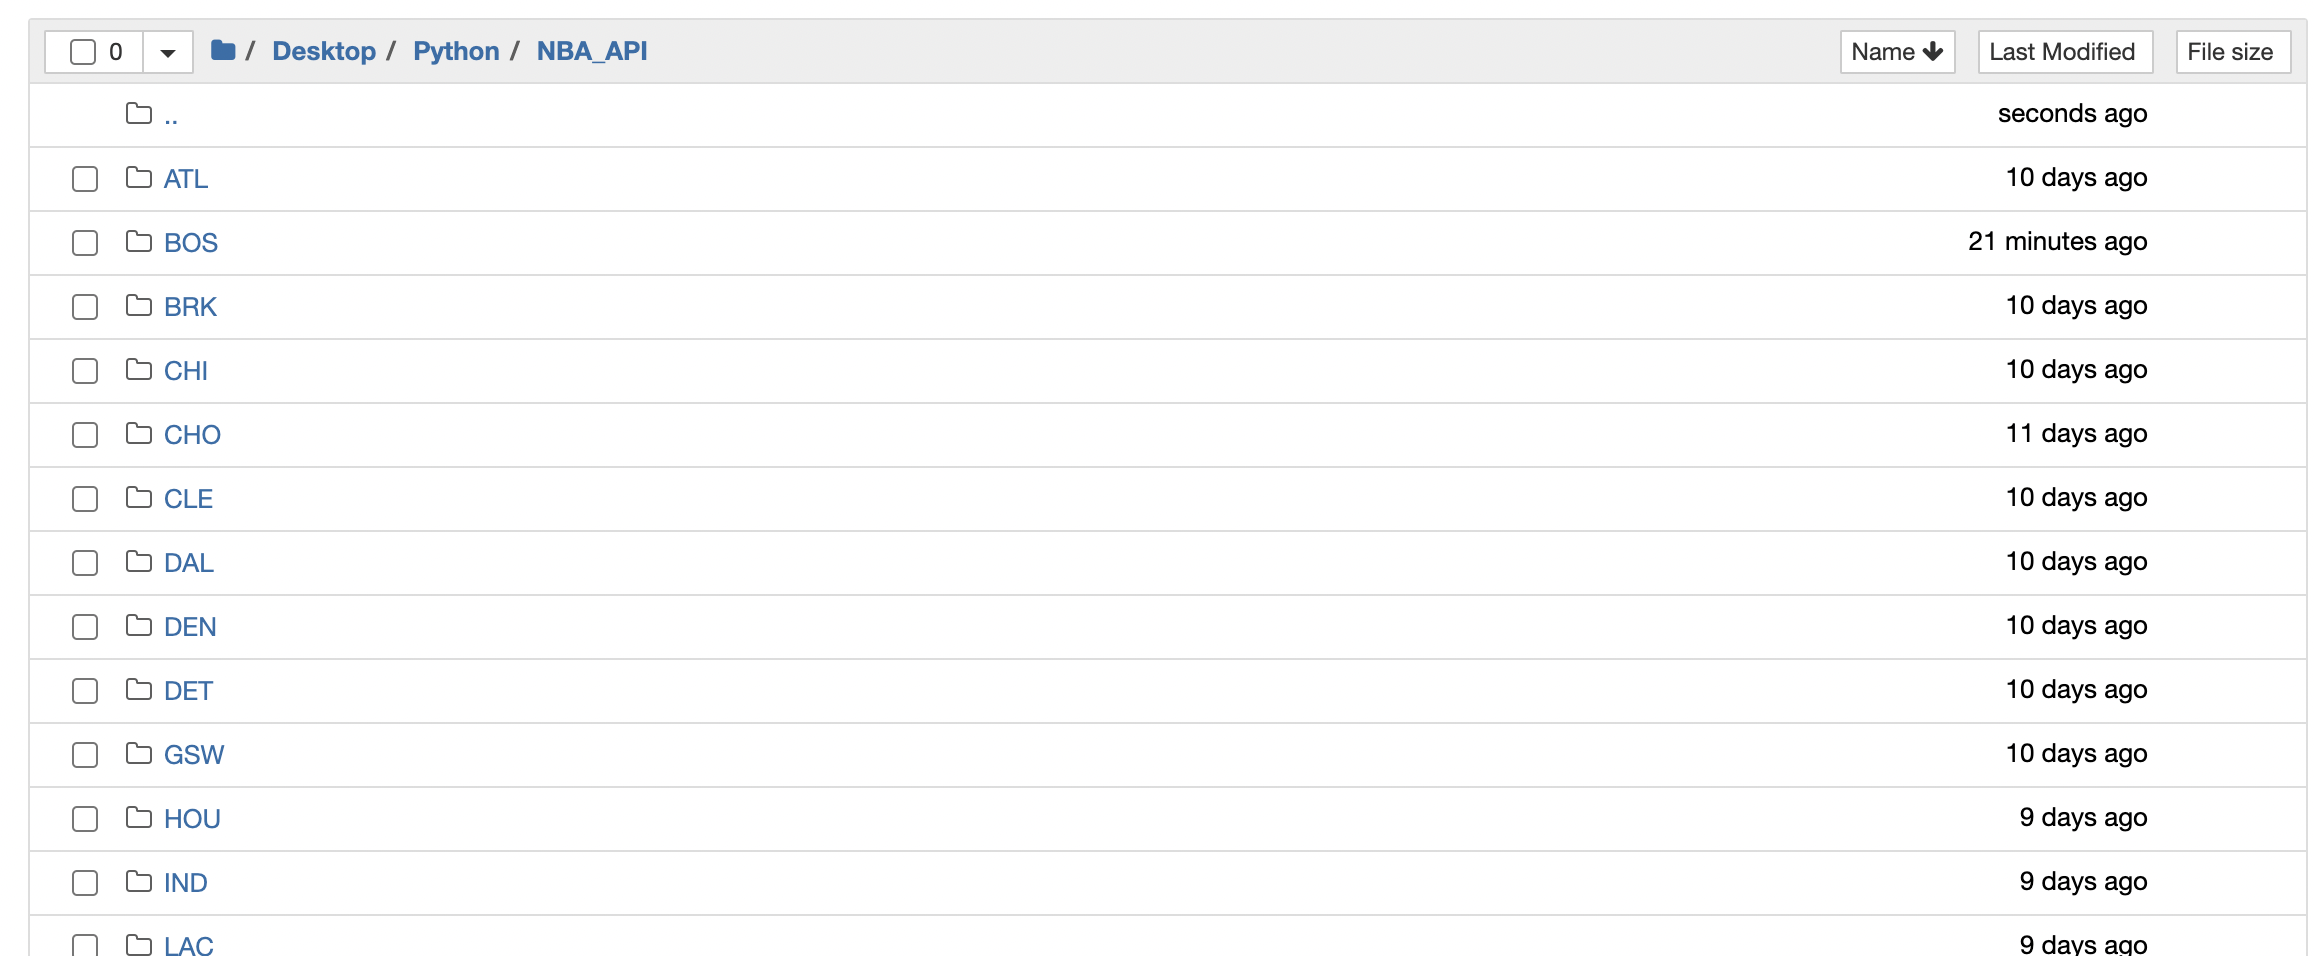
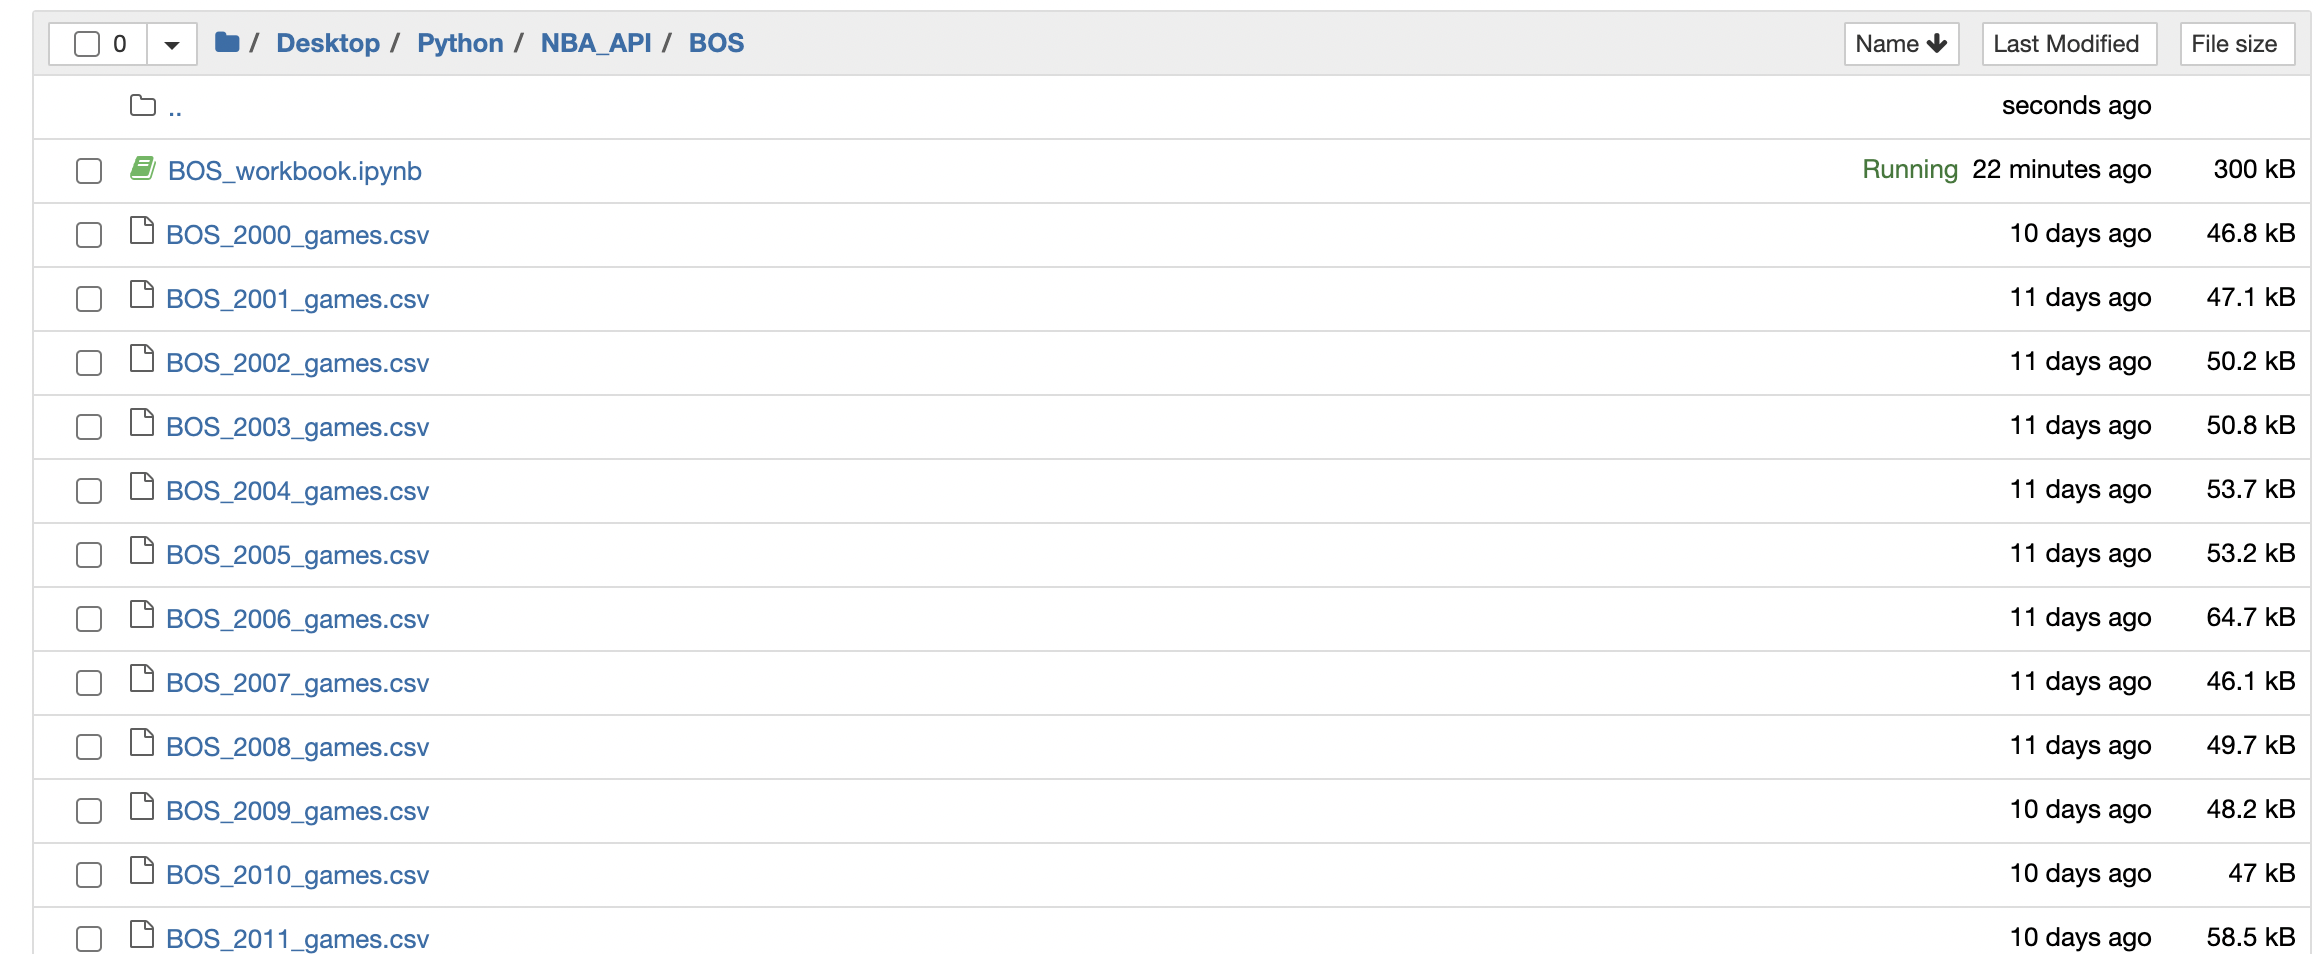
With the API, I used a while loop that pulled in gamelogs for each player for every game of each season since 2000. I organized the data processing with NBA season as the iterator, and saved each gamelog to a dataframe specific for a given season and given team. I then saved the output into csv format for easier data engineering and analysis. I organized my file structure to consist of 30 folders for 30 teams, each containing 21 csv files with dataframes of each player's gamelog for every game of a certain season.

Then for each team, I appended all dataframes into one master dataframe with all game logs for every player since the 2000 season. I then ranked by highest GAME_SCORE to rank the best individual games for each NBA team since 2000.

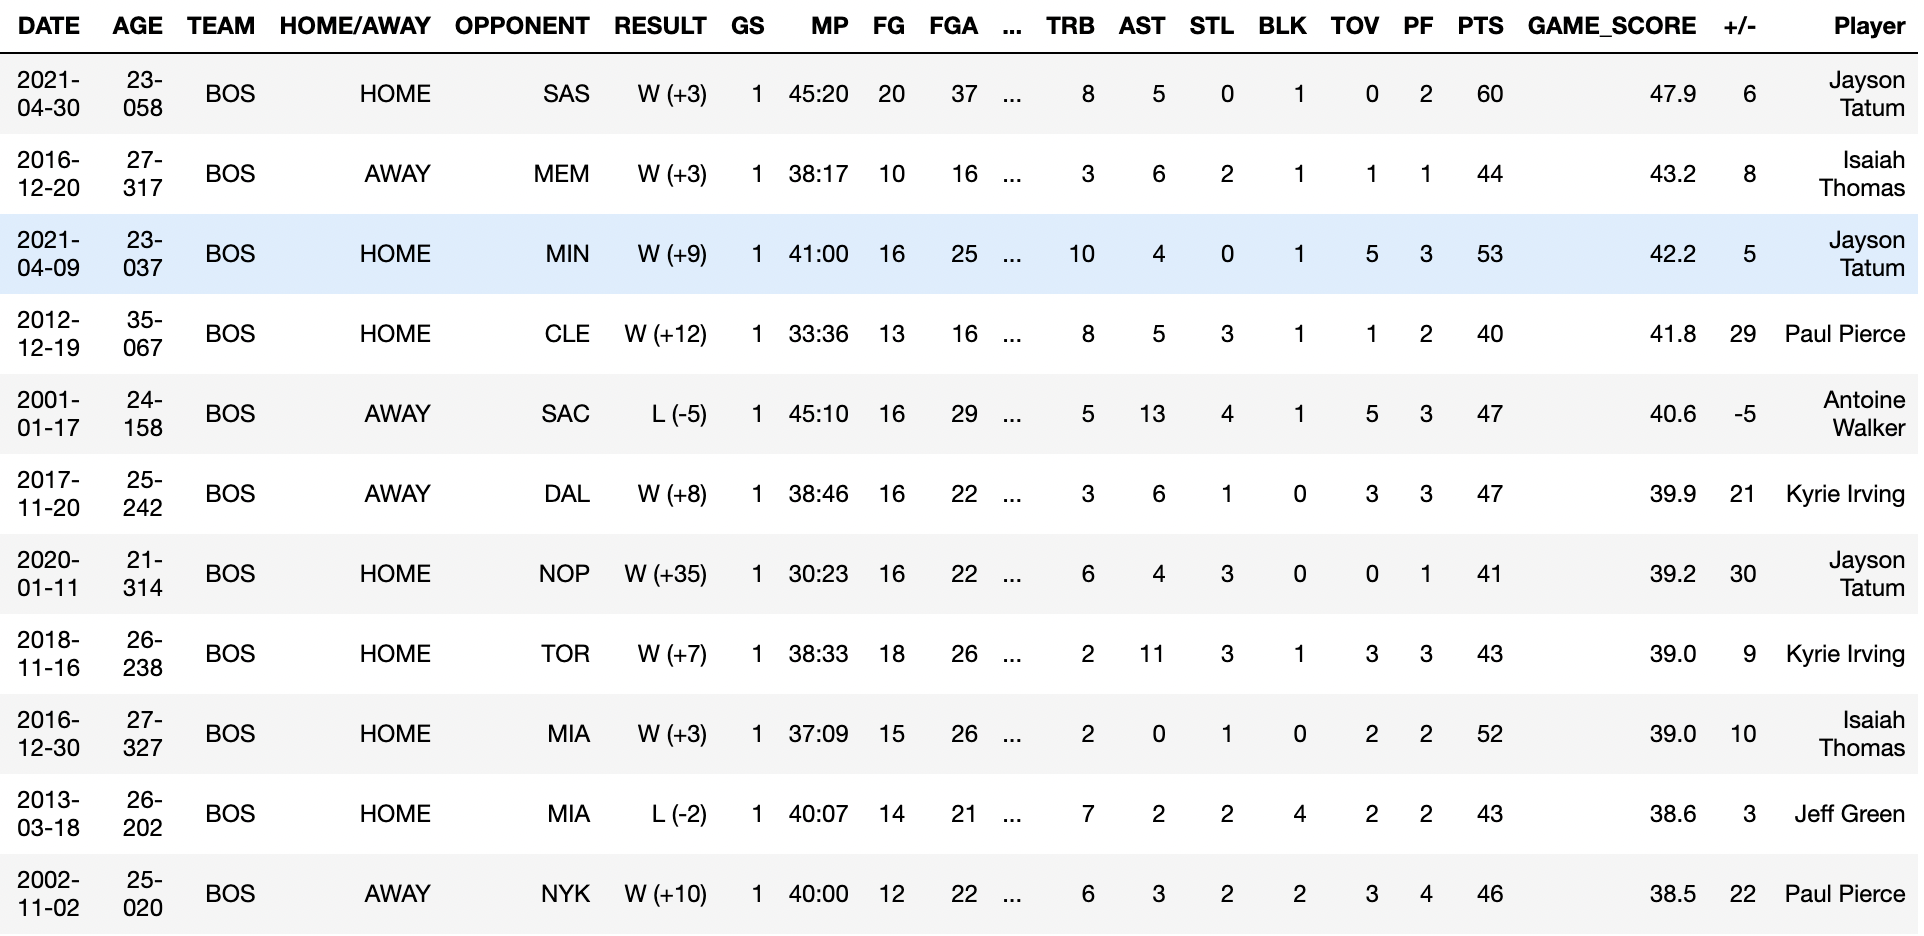
I then appended all team dataframes to compile a master dataframe for each game log for each player on each team for each season since since 2000. I also ranked this by GAME_SCORE.

Appendix: Storing the data - enter MySQL
Now that I have all the data for every game played by every NBA player since the 2000 season, I need a place to store the data. For this I rely upon SQL -- which I use with python for easier data manipulation.

