Pandas
Loading files and changing display options
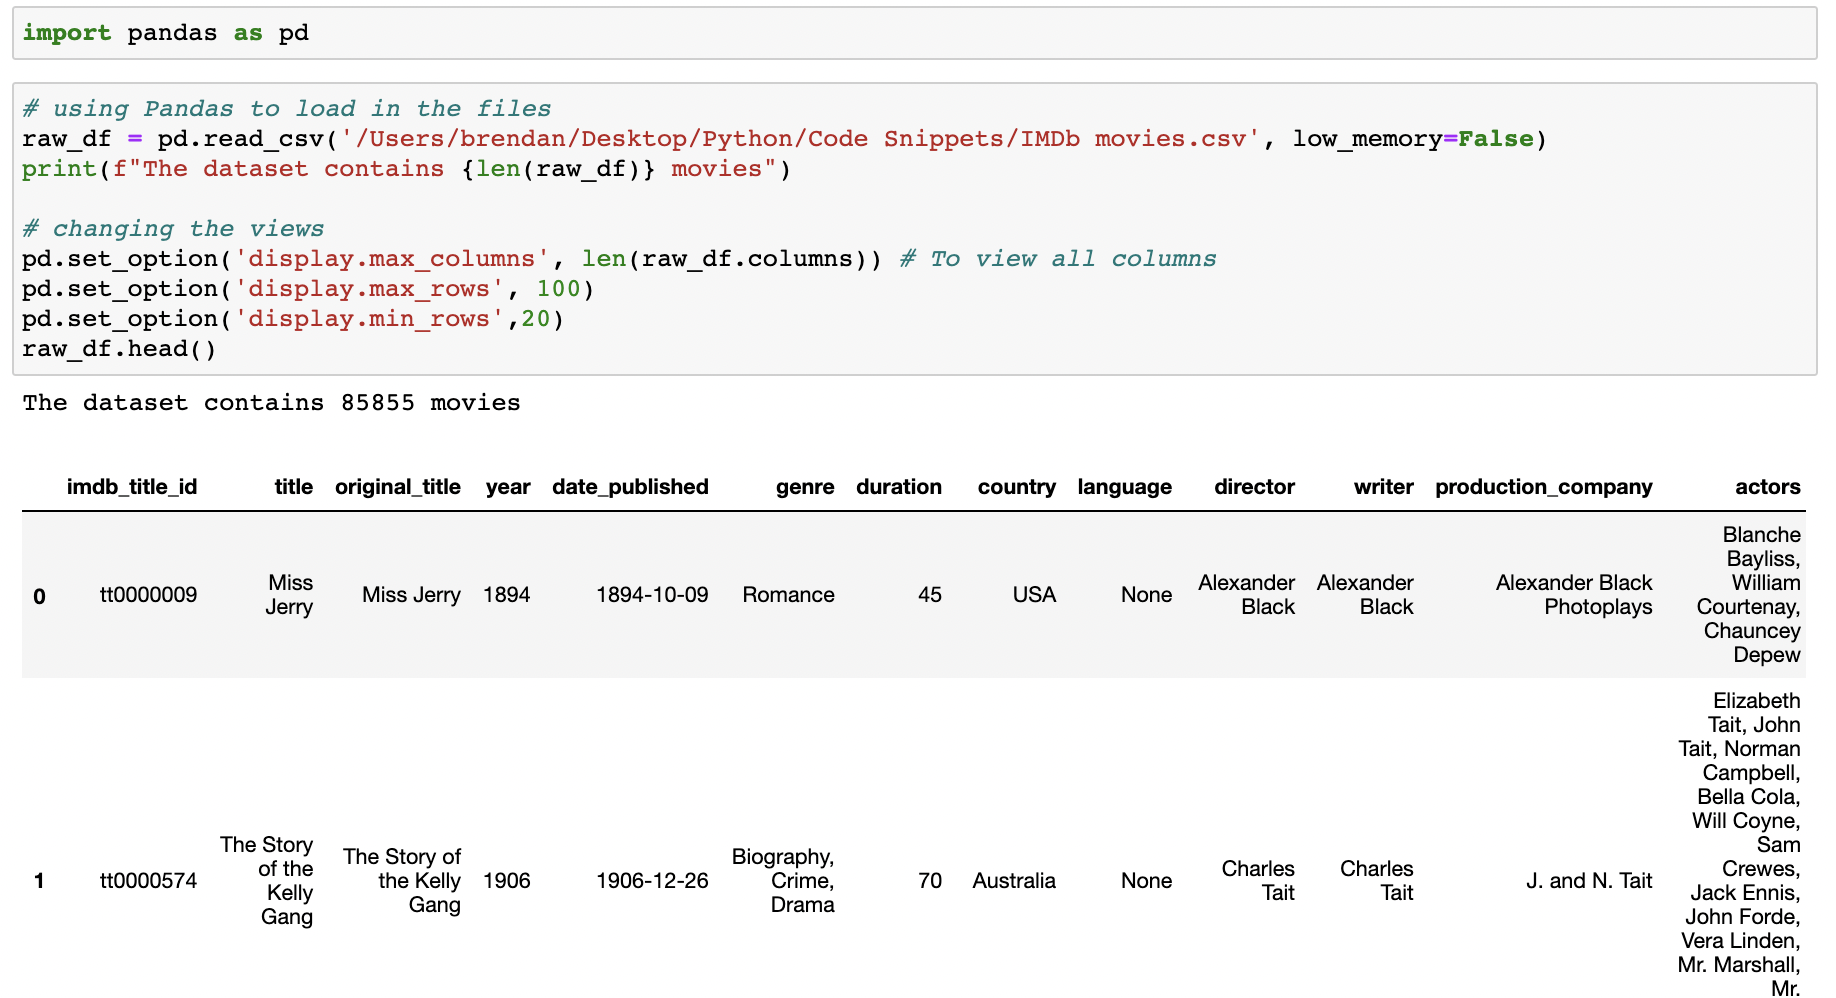
The below code uses pandas to read in data from a csv file, then prints an f-string that summarizes the size of the loaded-in DataFrame. Then I change the viewing options to show a minimum of 20 rows, a max of 100 rows, and the # of visible columns is set to the # of total columns in the dataset.

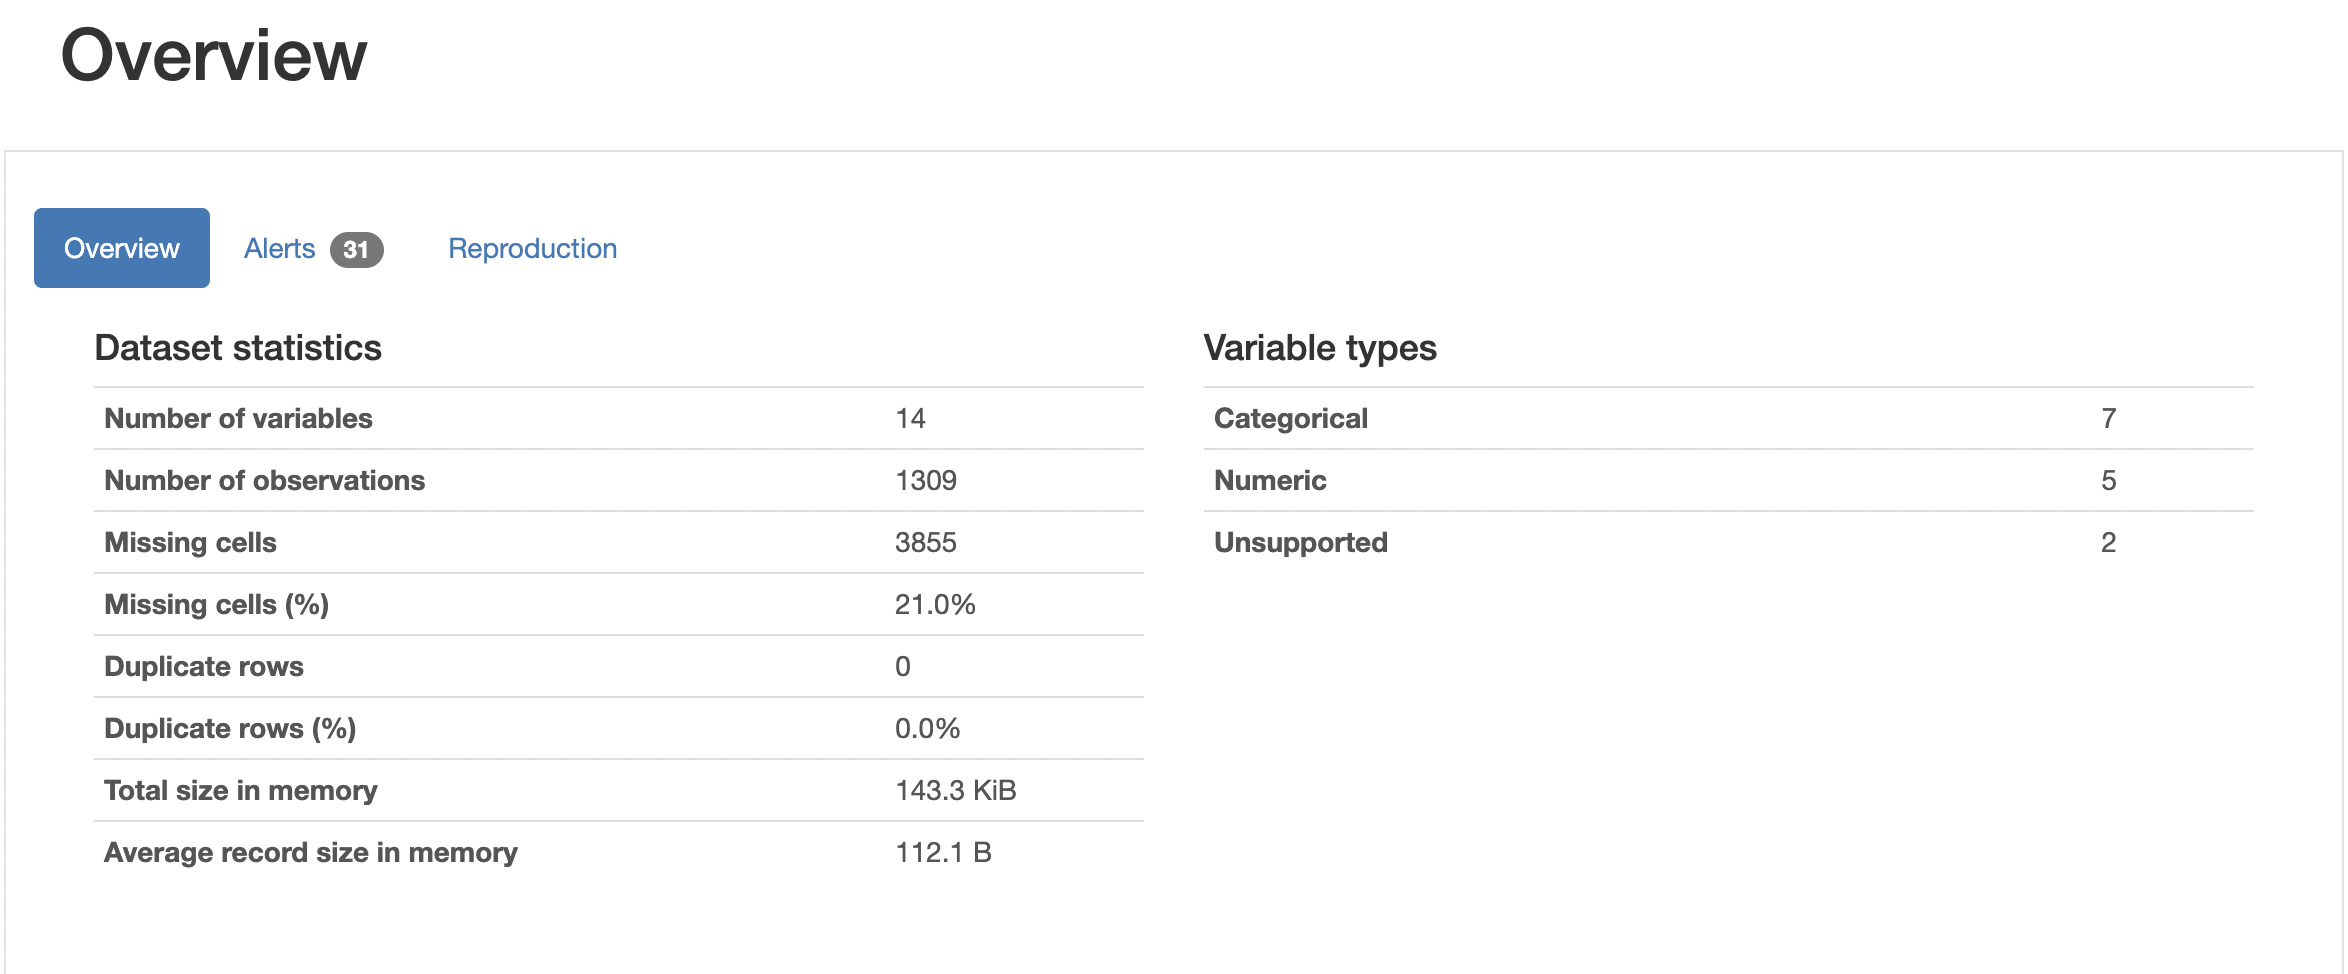
The excellent pandas_profiling package can be used to create a profile report for a given DataFrame in html format
Click here for a sample profile report from the popular titanic survivors dataset. The report succintly summarizes the data set and serves as a great starting point for analysis of any large datasets. The example below categorizes the data by variable type but there is so much more in the report.
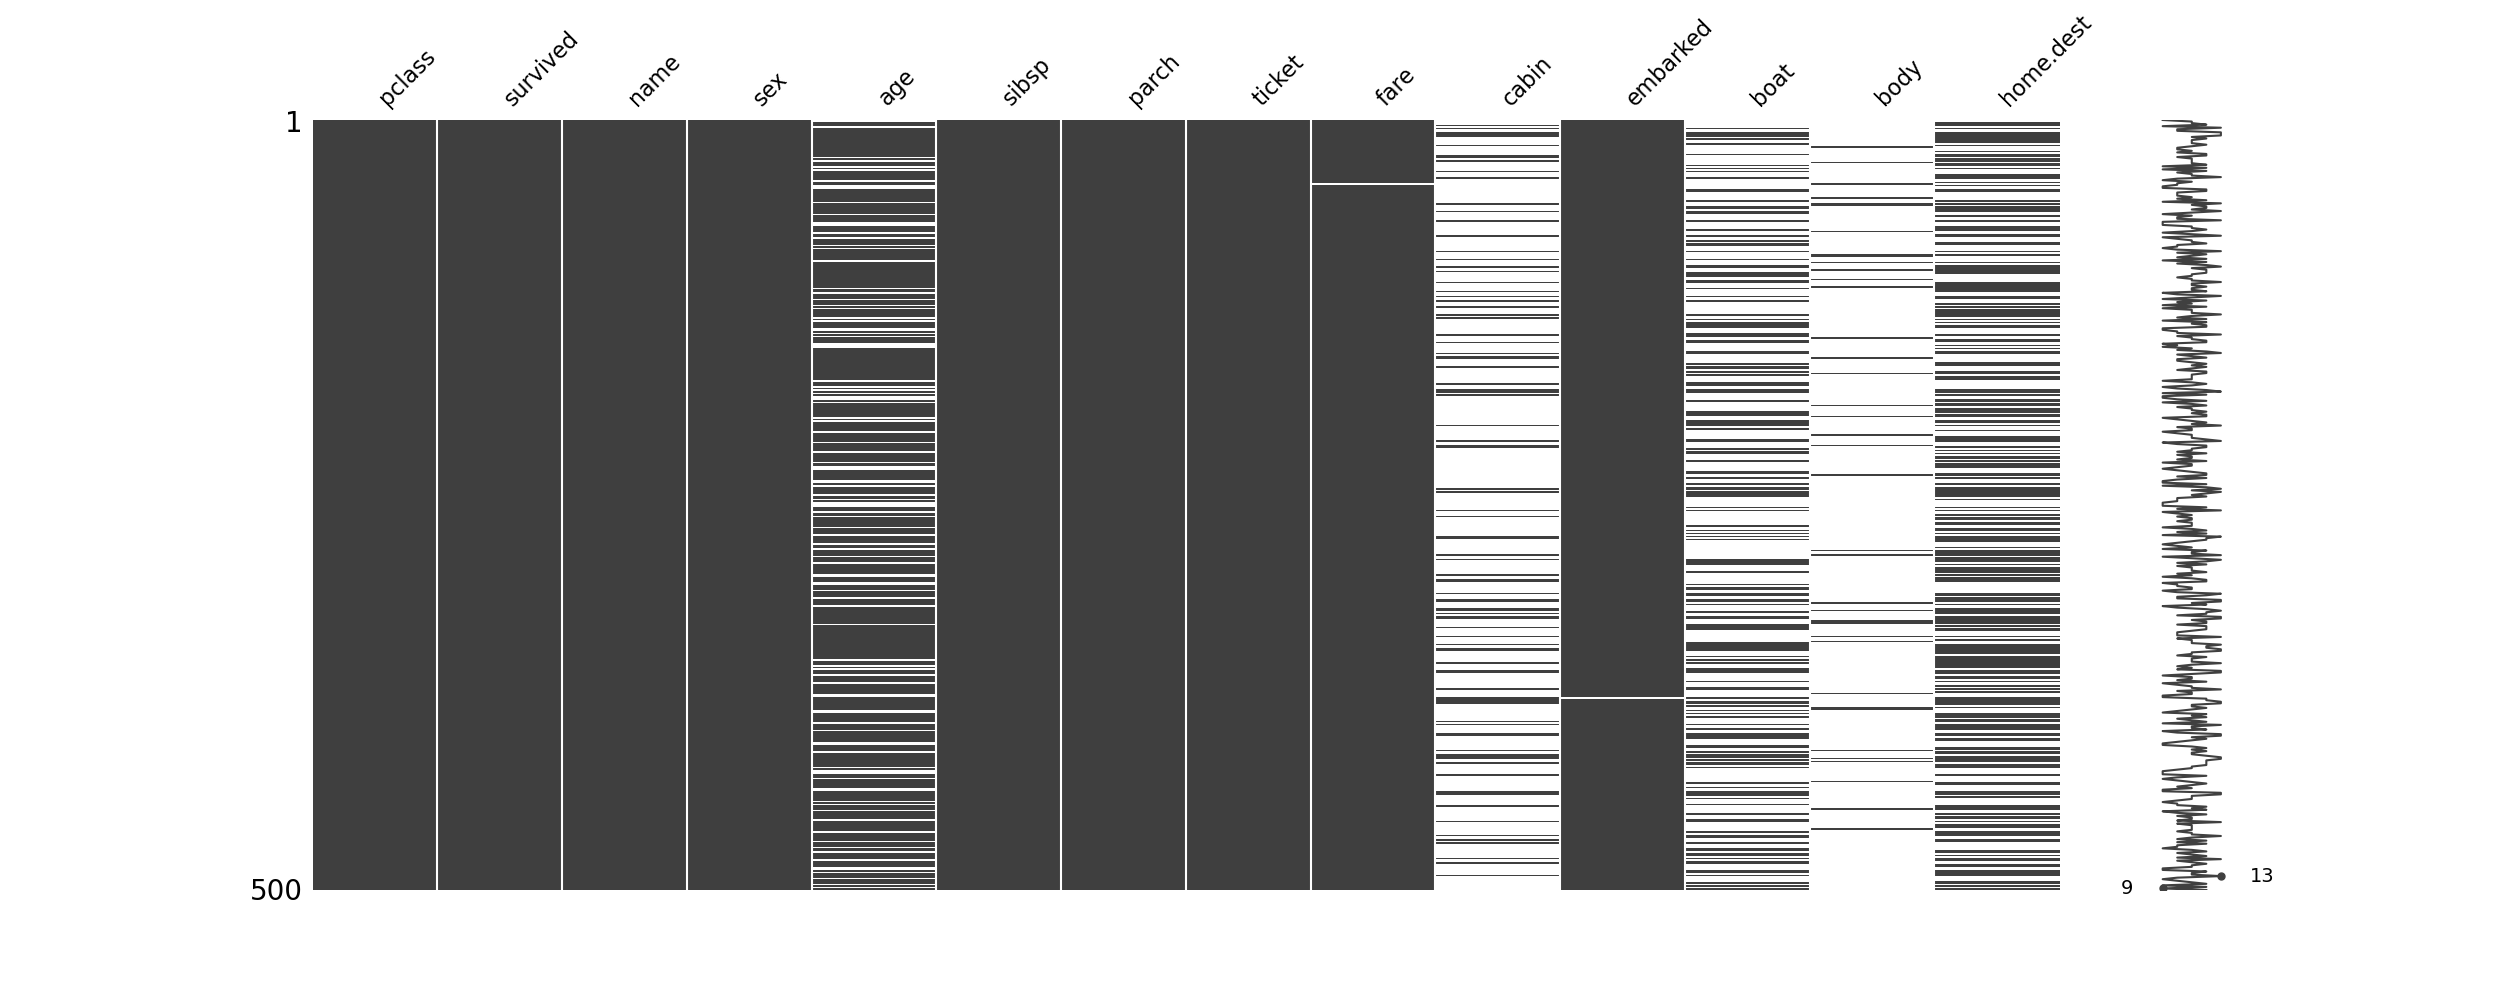
Identifying and examining missing values and dropping null values
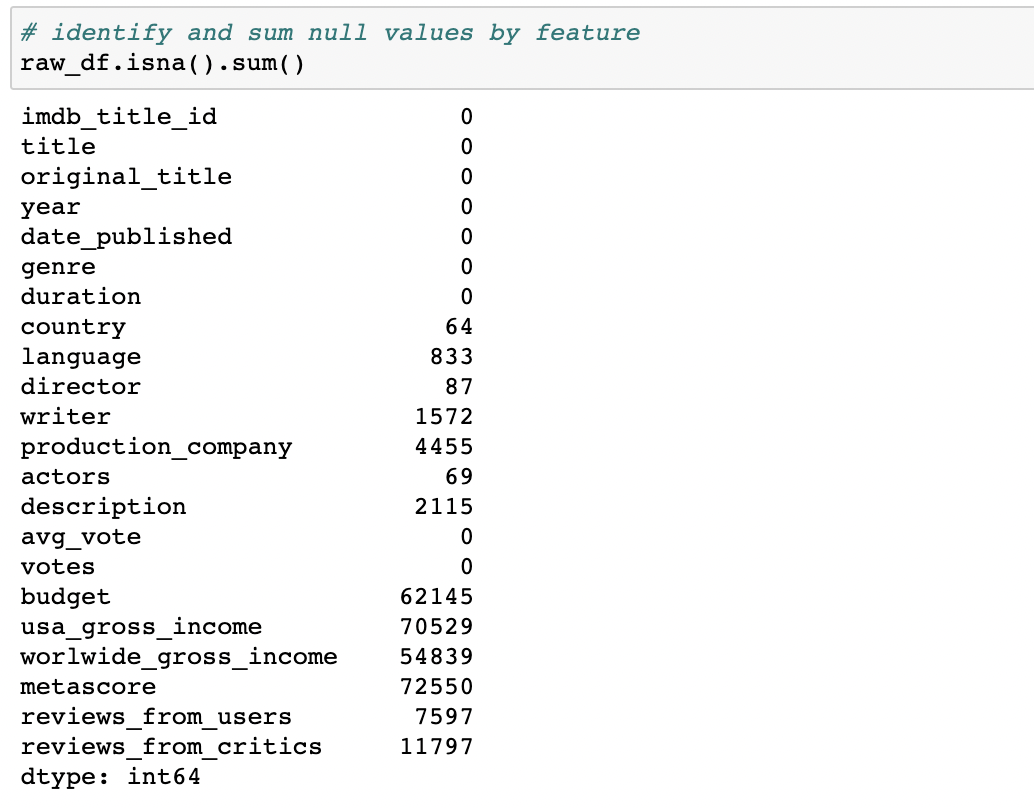
The below code counts/sums the total # of missing values by variable.
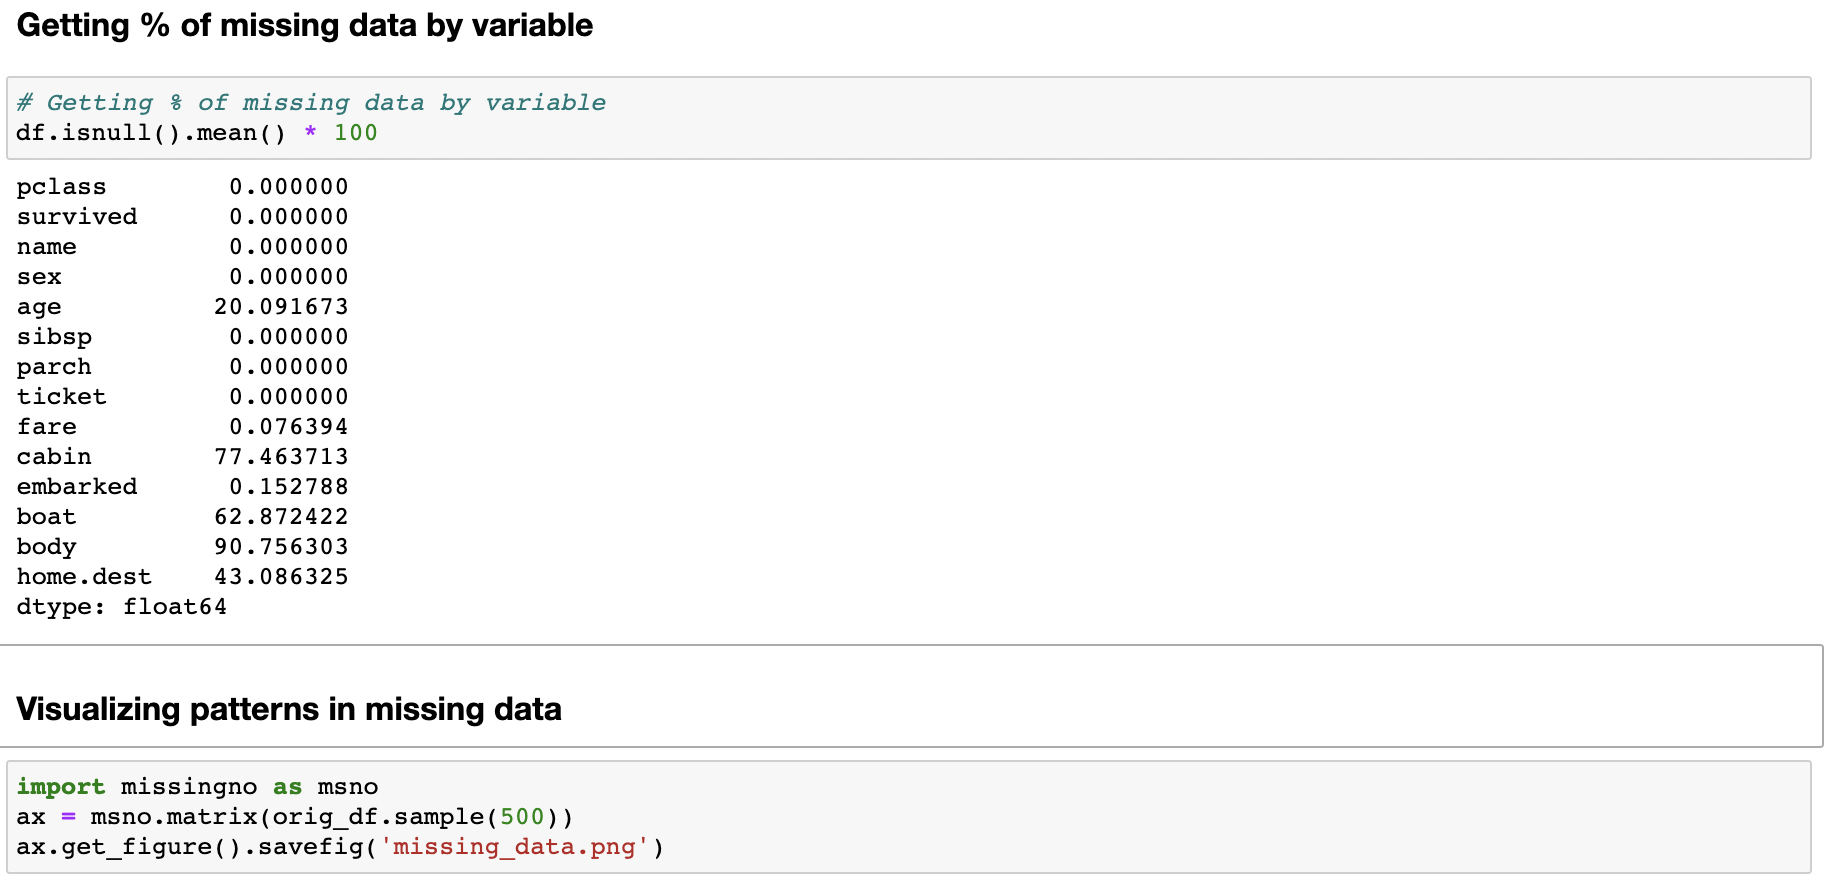
Calculate # of missing values in each column, and then sort
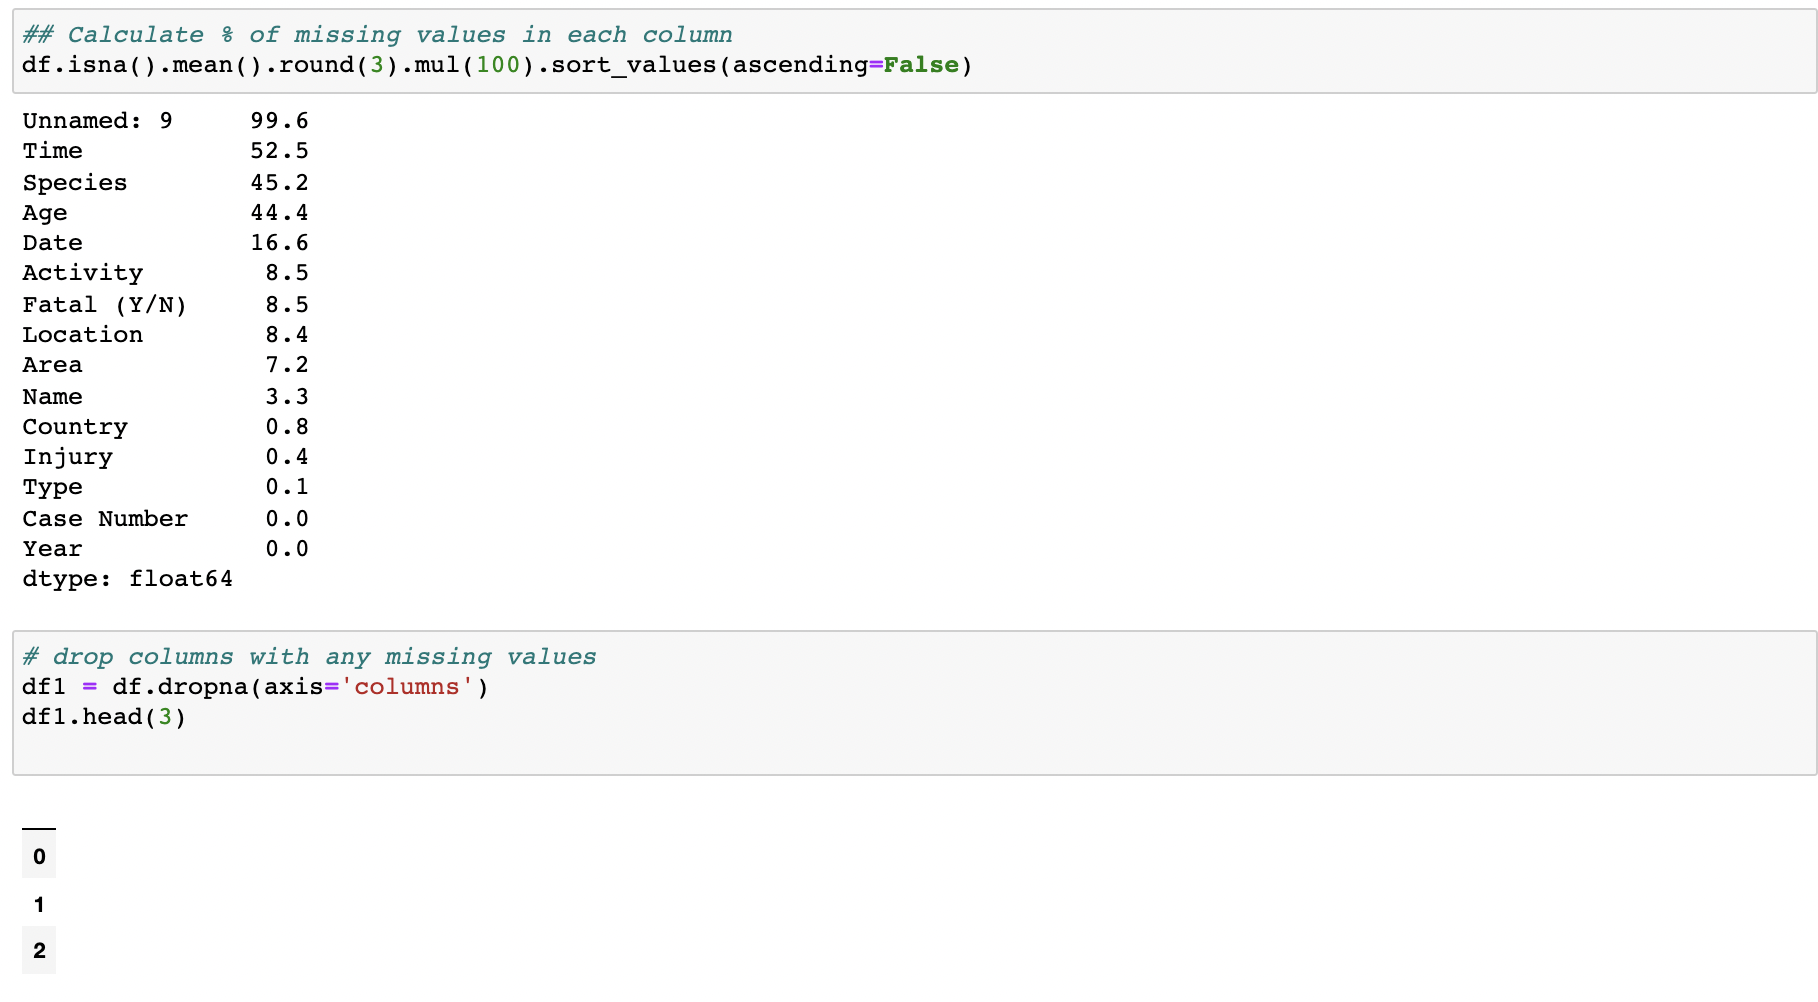
Dropping columns with null values, and also conditionally drop based on missing data threshholds

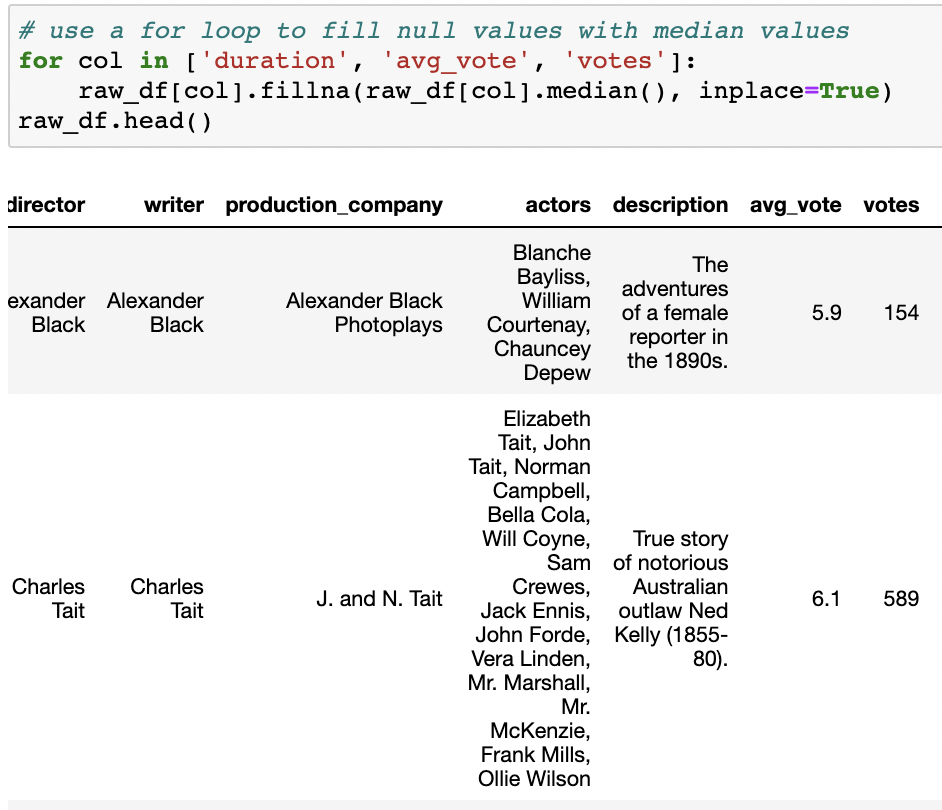
Using a for loop to fill null values with the median values
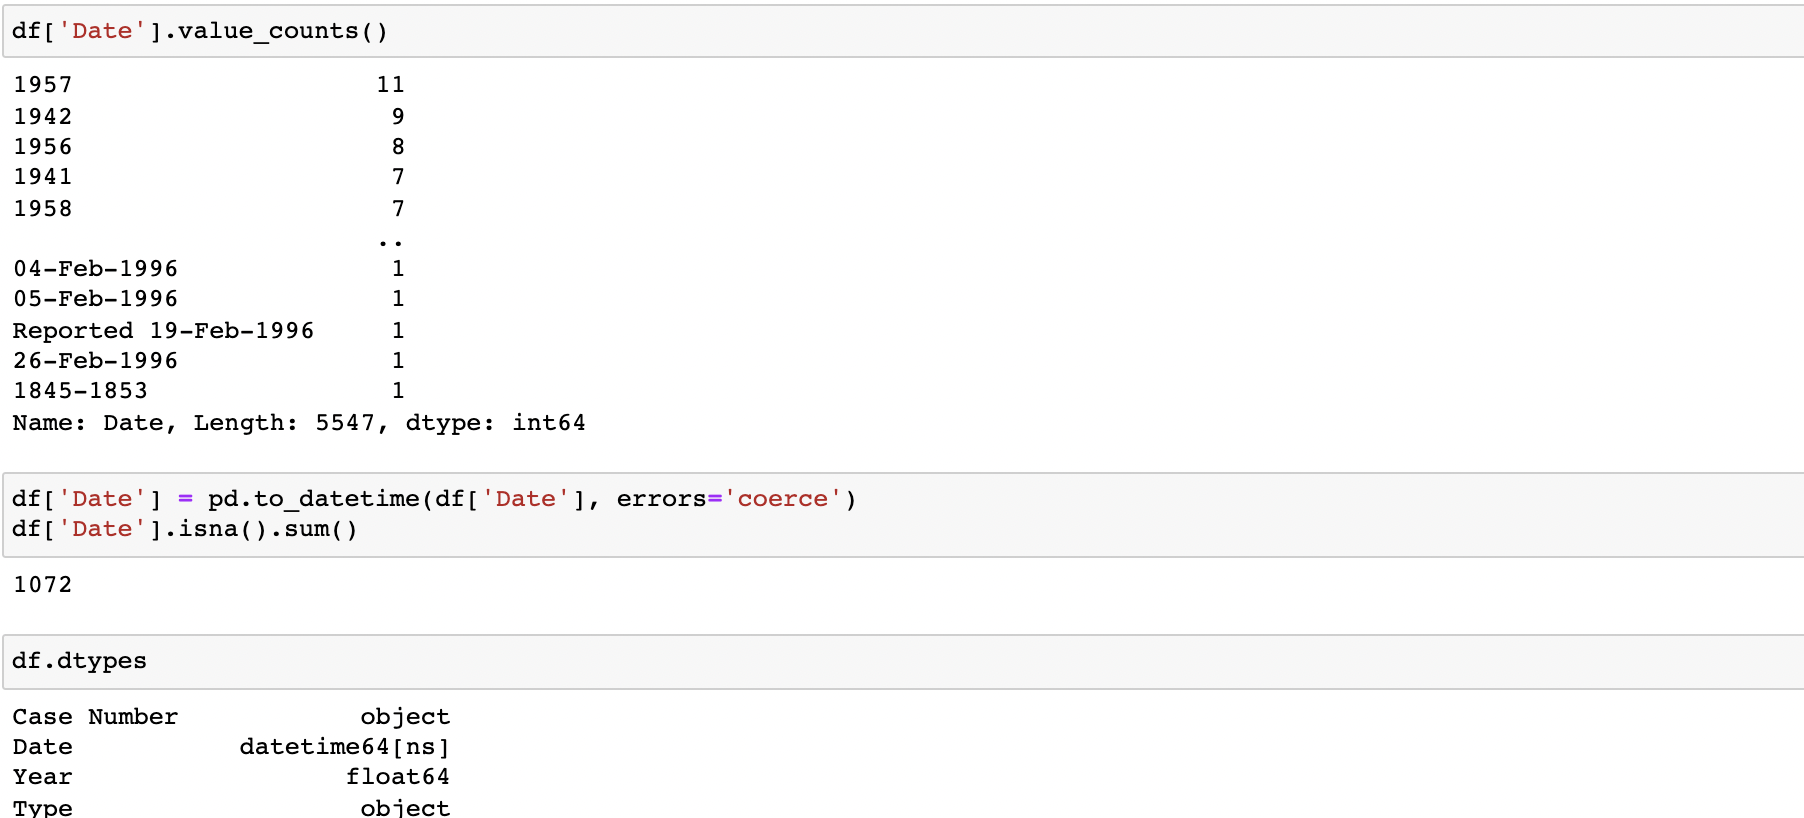
When dealing with messy datetime data - use "errors='coerce'" to make non-dates into NaT values
Formatting integers/floats in DataFrames through method-chaining
Q Cut and percentiles/quantiles