Paris is always a good idea: Identifying the best -- and most mispriced -- airbnb units in Paris, using BeautifulSoup, pandas, MatplotLib/Seaborn, and scikit-learn
December 15, 2021
“If you are lucky enough to have lived in Paris as a young man, then wherever you go for the rest of your life, it stays with you, for Paris is a moveable feast.” This was true for Ernest Hemingway, and it is certainly true for me. I studied abroad in Paris from February to June 2009 and it was a seminal point in my life - I fell in love with the city and the culture and grew tremendously as a person.
Since my study abroad tour de force in 2009, I have been back to the city I love several times, each time staying at an AirBnb location in a different neighborhood to experience the city from a different perspective. As I look forward to 2022 and a (hopeful) return of global leisure travel, my goal is to use Python to find the most desired Airbnbs location in the city of Paris...and later, all of Europe.

Key takeaways -- the best Airbnb locations in Paris, with predicted prices the result of multiple regression:
For units that accommodate 4 guests or less (with links to visit the listing), sorted by highest expected price:
| Title | Listing url | Accommodates | Neighborhood | Price* | Expected Price |
|---|---|---|---|---|---|
| CLASSY STUDIO TOUR EIFFEL | https://www.airbnb.com/rooms/24236332 | 2 | Palais-Bourbon | 150 | 430.31 |
| Duplex 110 m2, 3 bedrooms, heart of marais | https://www.airbnb.com/rooms/1852465 | 4 | Hôtel-de-Ville | 250 | 343.46 |
| Cœur de paris | https://www.airbnb.com/rooms/17664057 | 4 | Popincourt | 200 | 337.15 |
| Nice apartment/balcony/Montmartre Opera | https://www.airbnb.com/rooms/6058893 | 4 | Opéra | 210 | 319.94 |
| Beautiful XIX c. Style Apartment | https://www.airbnb.com/rooms/348747 | 4 | Élysée | 260 | 319.03 |
For units that accommodate less than 6 guests:
| Title | Listing url | Accommodates | Neighborhood | Price* | Expected Price |
|---|---|---|---|---|---|
| Superb 4 bdrms 185m2 Apt Trocadero | https://www.airbnb.com/rooms/2249308 | 6 | Passy | 650 | 463.18 |
| A typical Parisian apartment: | https://www.airbnb.com/rooms/10800486 | 6 | Vaugirard | 300 | 454.73 |
| Flat 234m2 , 4 bedrooms, near Trocadéro | https://www.airbnb.com/rooms/19903973 | 6 | Passy | 280 | 439.52 |
| Nice family place near Trocadero | https://www.airbnb.com/rooms/3487818 | 6 | Passy | 290 | 434.46 |
| NEW-MAGIC VIEW - PARIS 7 VARENNE- | https://www.airbnb.com/rooms/9353416 | 6 | Palais-Bourbon | 450 | 397.57 |
For all units - no limitation on guest count:
| Title | Listing url | Accommodates | Neighborhood | Price* | Expected Price |
|---|---|---|---|---|---|
| Luxury 190 m² "Pied à terre" in the Heart of Paris | https://www.airbnb.com/rooms/15658427 | 14 | Bourse | 1,386 | 804.27 |
| République, renovated 2016 6 bdrms,3WC,3 bathrooms | https://www.airbnb.com/rooms/13243111 | 16 | Entrepôt | 280 | 712.90 |
| Luxury 6Bdr 5Bth in Heritage Building - LOUVRE VIEW | https://www.airbnb.com/rooms/35984086 | 12 | Louvre | 810 | 682.61 |
| Maison Parisienne - Central Paris | https://www.airbnb.com/rooms/16905683 | 10 | Popincourt | 707 | 660.66 |
| Wonderful house in the center of Paris | https://www.airbnb.com/rooms/20798740 | 10 | Popincourt | 720 | 653.59 |
* Price refers to the price at the instance the information was scraped.
Expected price is the output of regression models, and includes the following parameters: # of guests, # of beds, # of bedrooms, availability in the past 90 days, and guest reviews (scale of 1-5) for: overall rating, accuracy, cleanliness, location, and value.
The raw code working file for data preprocessing and data exploration can be viewed here.
The raw code working file for regression analysis can be viewed here.
The Datasets:
The dataset used for this project comes from Insideairbnb.com, which is actually an anti-Airbnb lobbying group that scrapes listings, reviews and calendar data for multiple cities around the world. The dataset that I used from the site was scraped on September 30, 2021. My inital data set compiled 50,133 Airbnb listings located in Paris. All in after data cleansing, my dataset included 50 variables (15 numeric, 34 categorical, 1 datetime) and across the 50,133 observations, 2.8% of the data included null or missing values (71,154 missing cells).
For a detailed summary of the Paris data set please click here.
I extended the analysis to include airbnb listings for additional European cities on the platform. This dataset has the same # of variables (15 numeric, 34 categorical, 1 datetime) and 280,558 observations for 20 additional cities, from Amsterdam to Vienna.
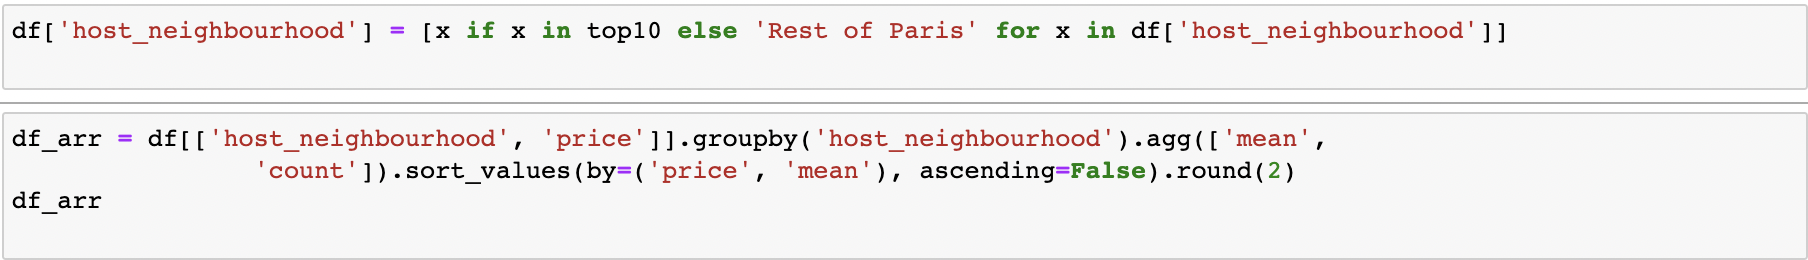
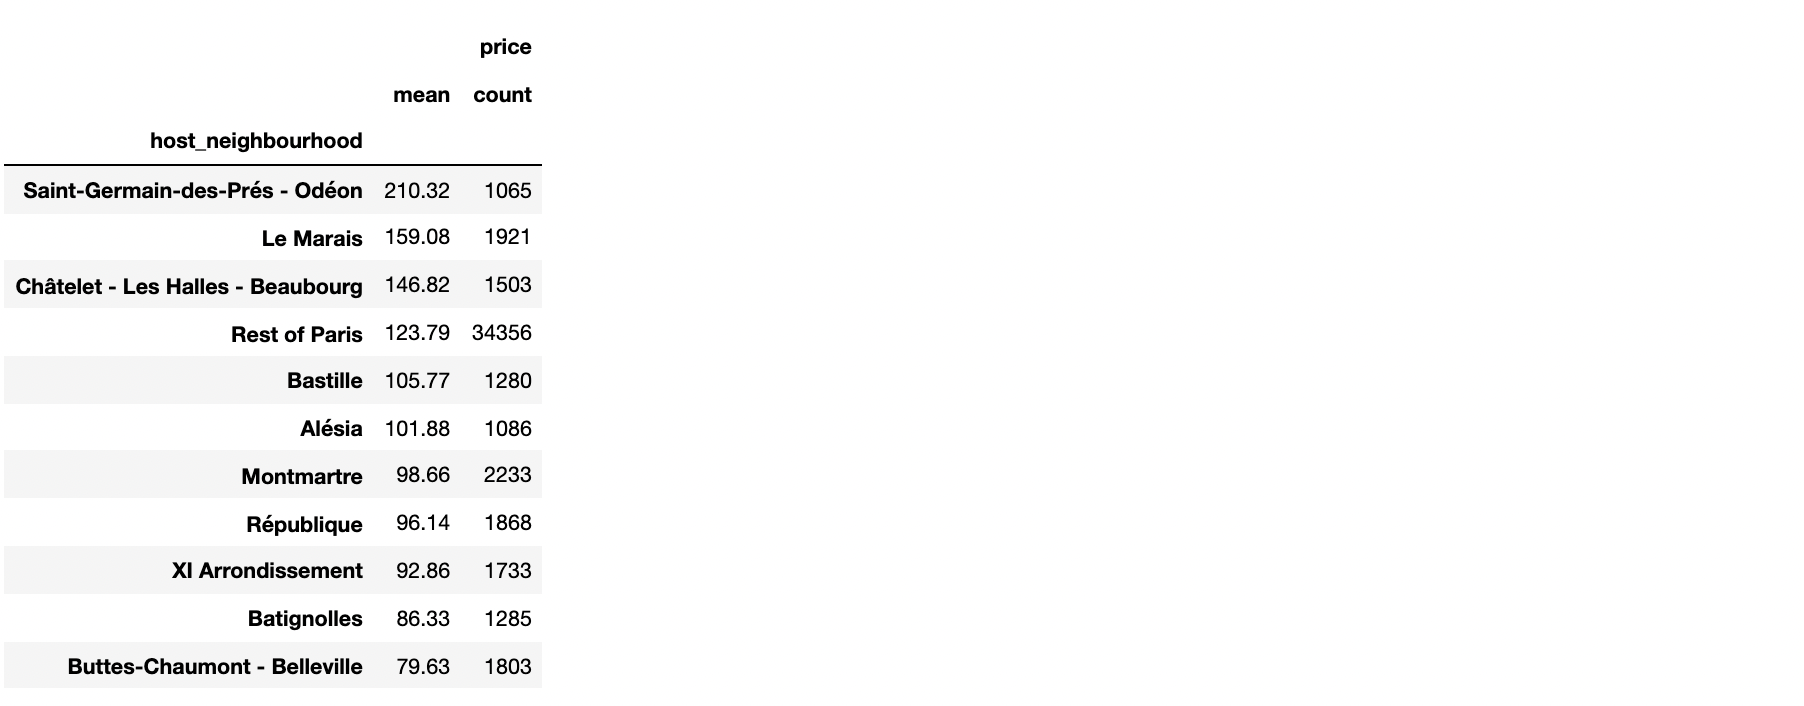
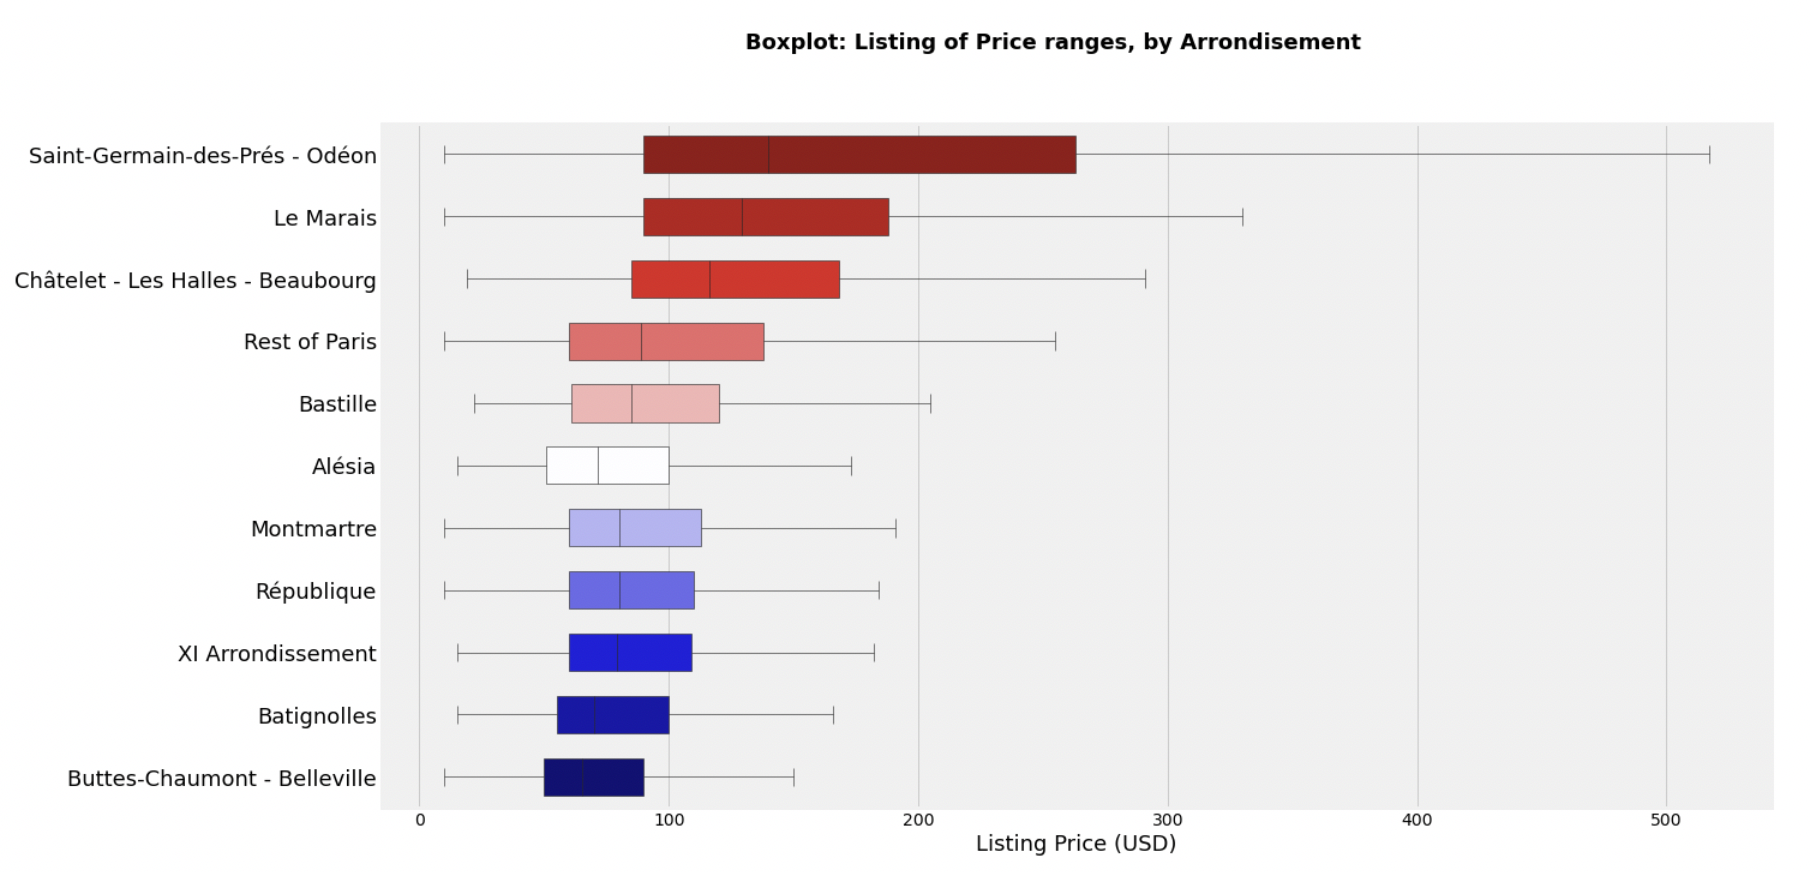
For a cursory look at the Paris dataset, below I have aggregrated and visualized each unit by neighborhood (in Paris these are referred to as 'arrondisements') and provided summary statistics, including unit count by arrondisement and average price. The box plot below depicts the distribution of nightly listing prices. The Saint-Germain-des-Pres/Odeon and Le Marais arrondisements have the highest average nightly prices, which is no surprise as these areas are arguably the prettiest and the most culturally important.
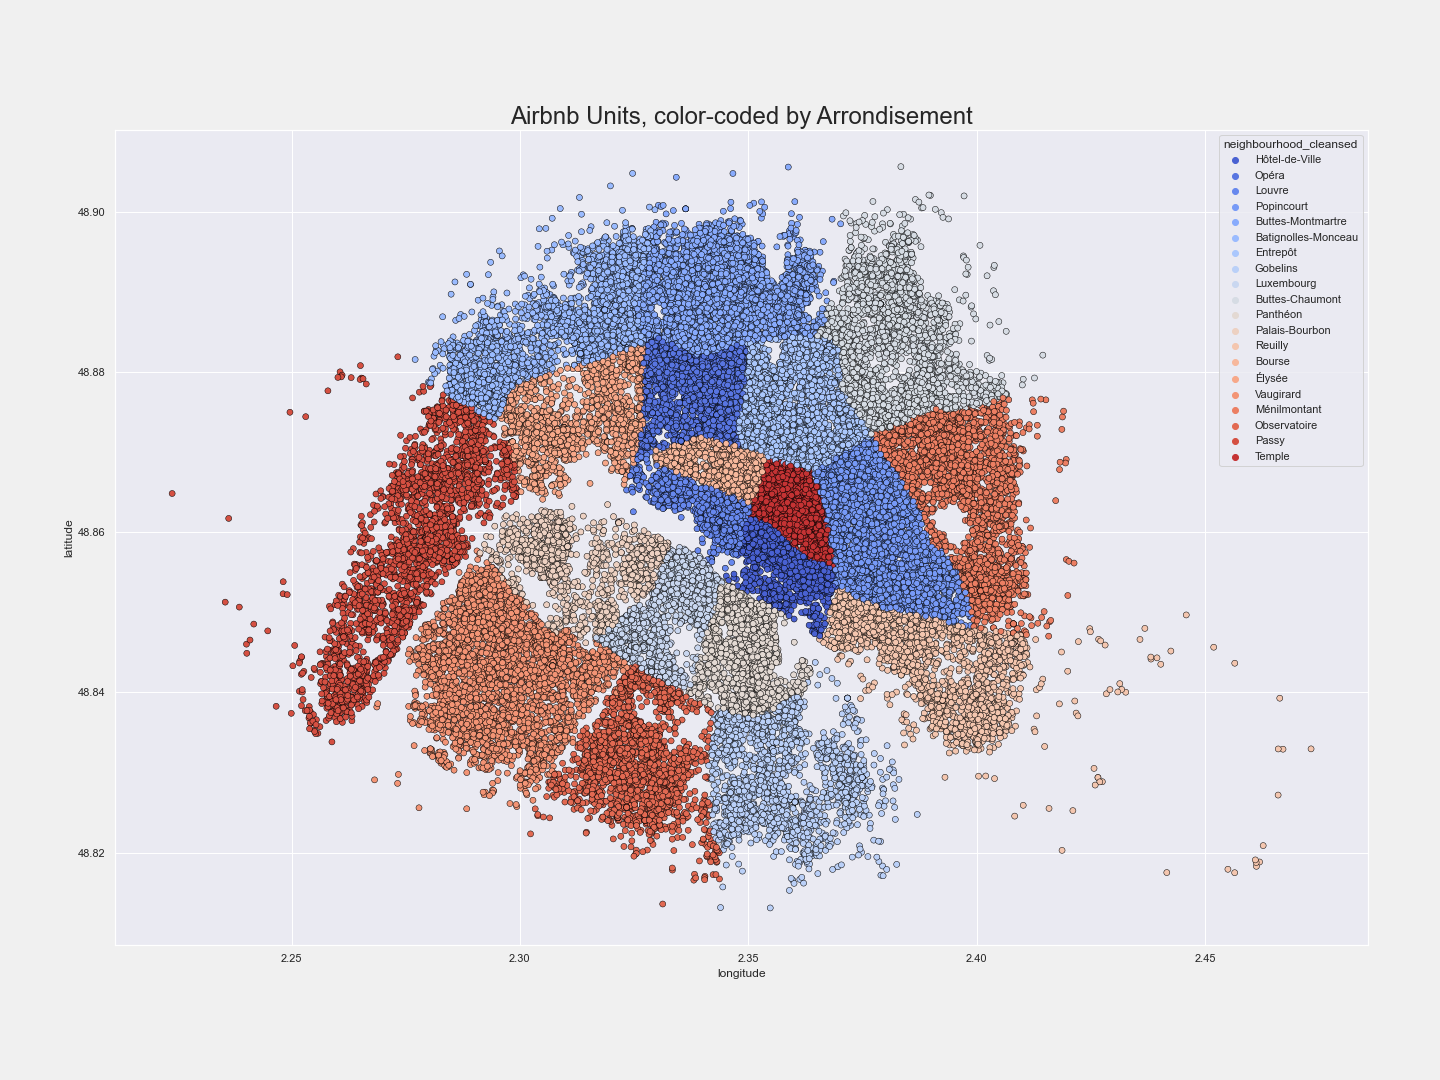
Below I used longitude and latitude data to plot all airbnb units and color-coded by arrondisement.
I have also conducted similar analysis for a several other EU-27 cities on the Airbnb platform - the goal of which was to use regression models to find the highest expected price units, as well as to identify the biggest gap between expected price and actual price. Please see links below:
- Amsterdam: 16,116 listings; avg of €156.91/day
- Antwerp: 1,776 listings; avg of €103.83
- Athens: 9,766 listings; avg of €83.44
- Barcelona: 16,055 listings; avg of €112.47
- Berlin: 17,500 listings; avg of €74.90
- Bordeaux: 9,424 listings; avg of €96.95
- Brussels: 5,336 listings; avg of €90.94
- Crete: 20,180 listings; avg of €225.38
- Dublin: 7,068 listings; avg of €301.72
- Florence: 10,548 listings; avg of €123.17
- Lisbon: 18,761 listings; avg of €104.58
- Lyon: 8,304 listings; avg of €91.59
- Madrid: 17,989 listings; avg of €135.09
- Milan: 17,231 listings; avg of €126.60
- Munich: 4,914 listings; avg of €120.75
- Naples: 7,142 listings; avg of €88.39
- Rome: 25,490 listings; avg of €127.01
- Sicily: 48,096 listings; avg of €100.18
- Venice: 7,568 listings; avg of €143.29
- Vienna: 11,294 listings; avg of €81.10

Data acquisition
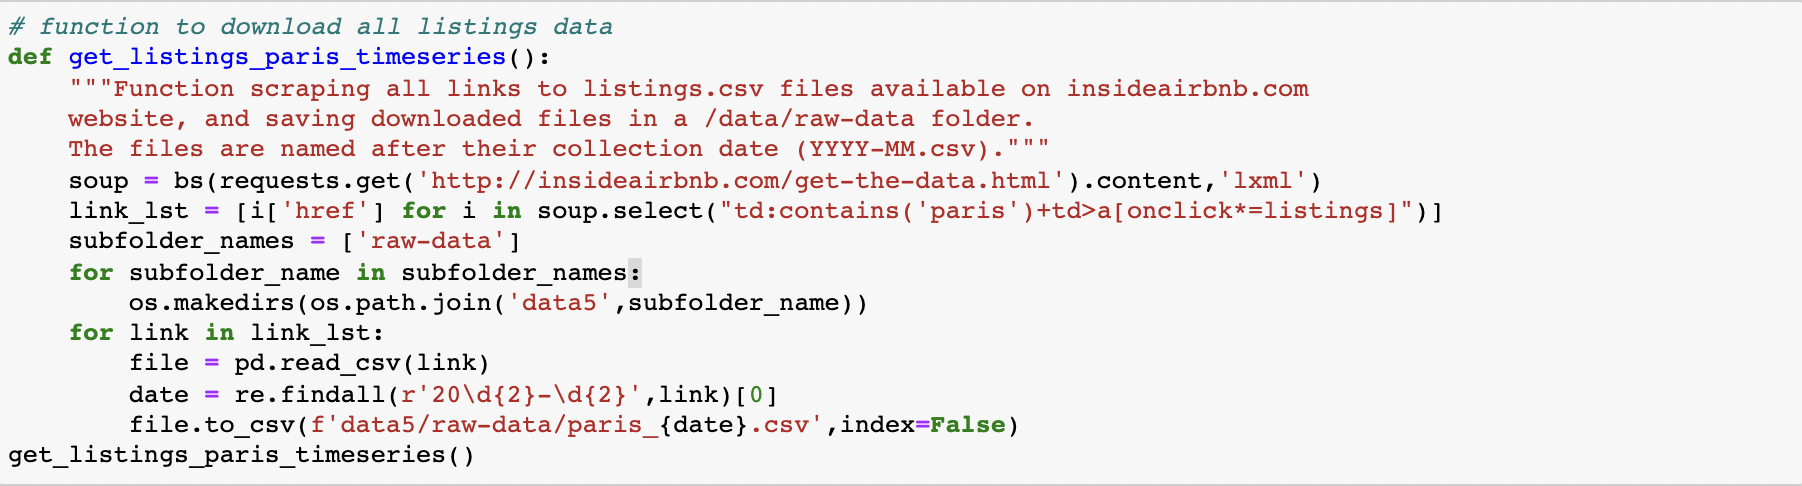
The underlying data I used for my analysis is located on insideairbnb.com (and is not affiliated with Airbnb the company). In order to acquire the data in the most efficient and systematic (repeatable) method, I wrote a function that relied on the BeautifulSoup package, which is used for web-scraping information from websites. My function pulled in the data from the website and then saved the information as a csv file with the date of each information package (the insideairbnb.com site publishes new listings data on a monthly basis). The code is reproduced below:
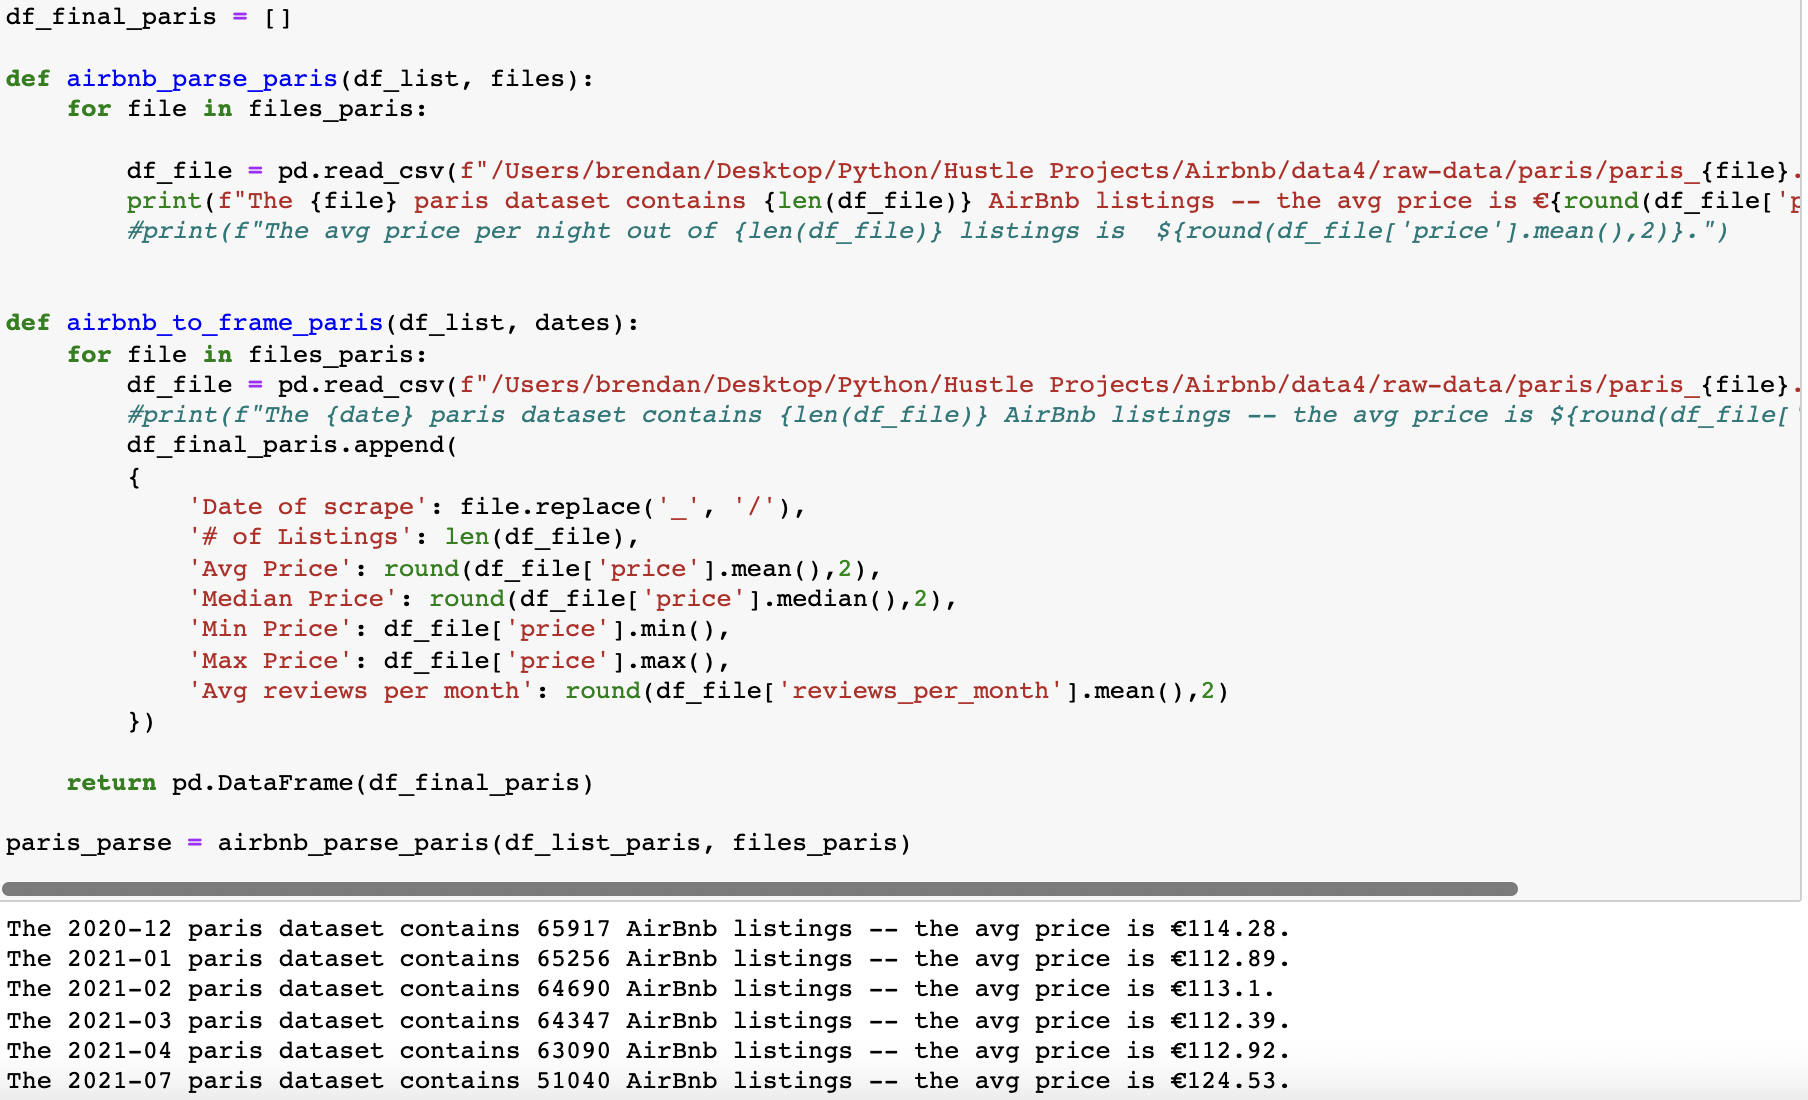
Next, I wrote functions that converted all csv files from the prior function to pandas dataframes, and then I appended all these monthly dataframes into a master dataframe for each city. As part of my function I also wrote code that provided summary information of each monthly dataframe that was loaded into the master dataframe. The code below shows that the Decmember 2012 dataframe contianes 65,917 listings, with an average price of 114.28 per night, whereas the July 2021 dataset contains 51,040 listings with an average price of 124.53 per night.
Regression Analysis
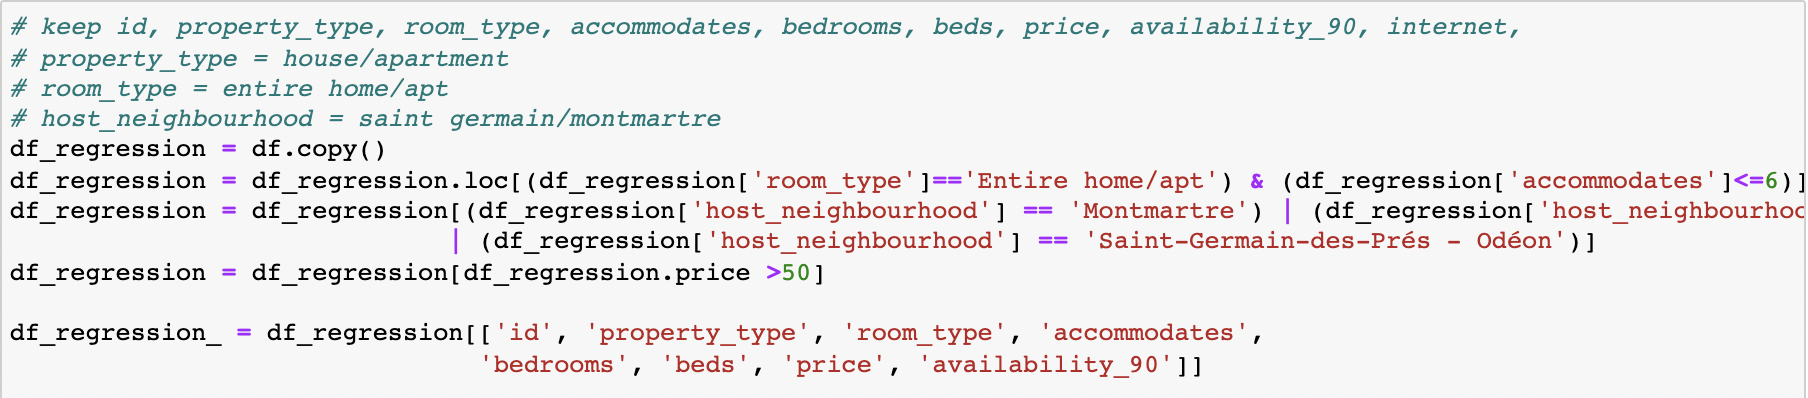
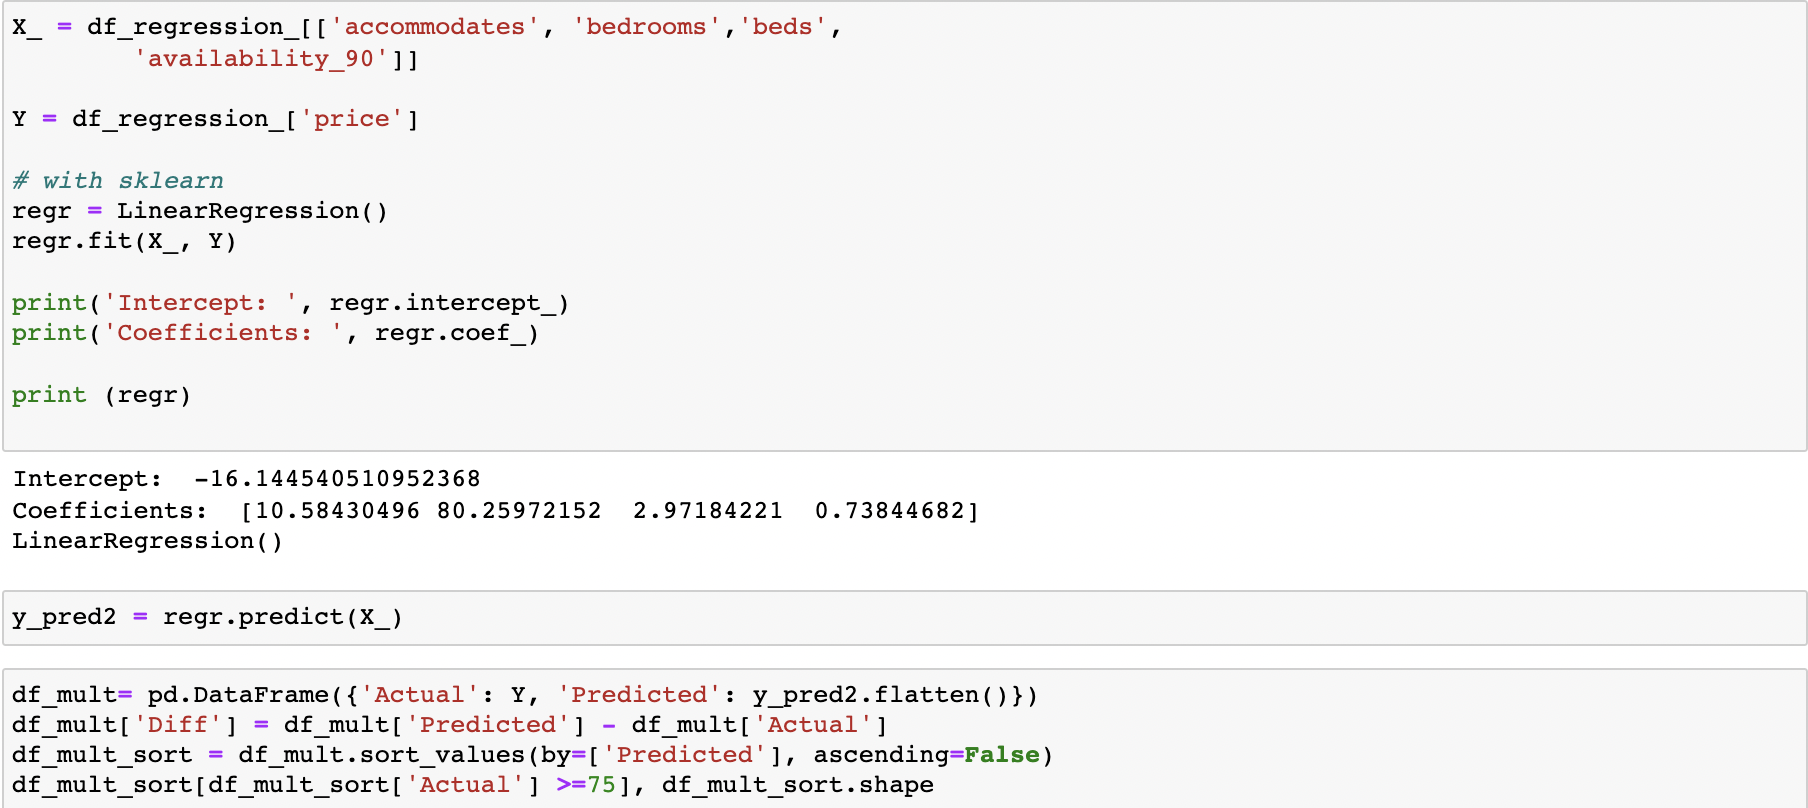
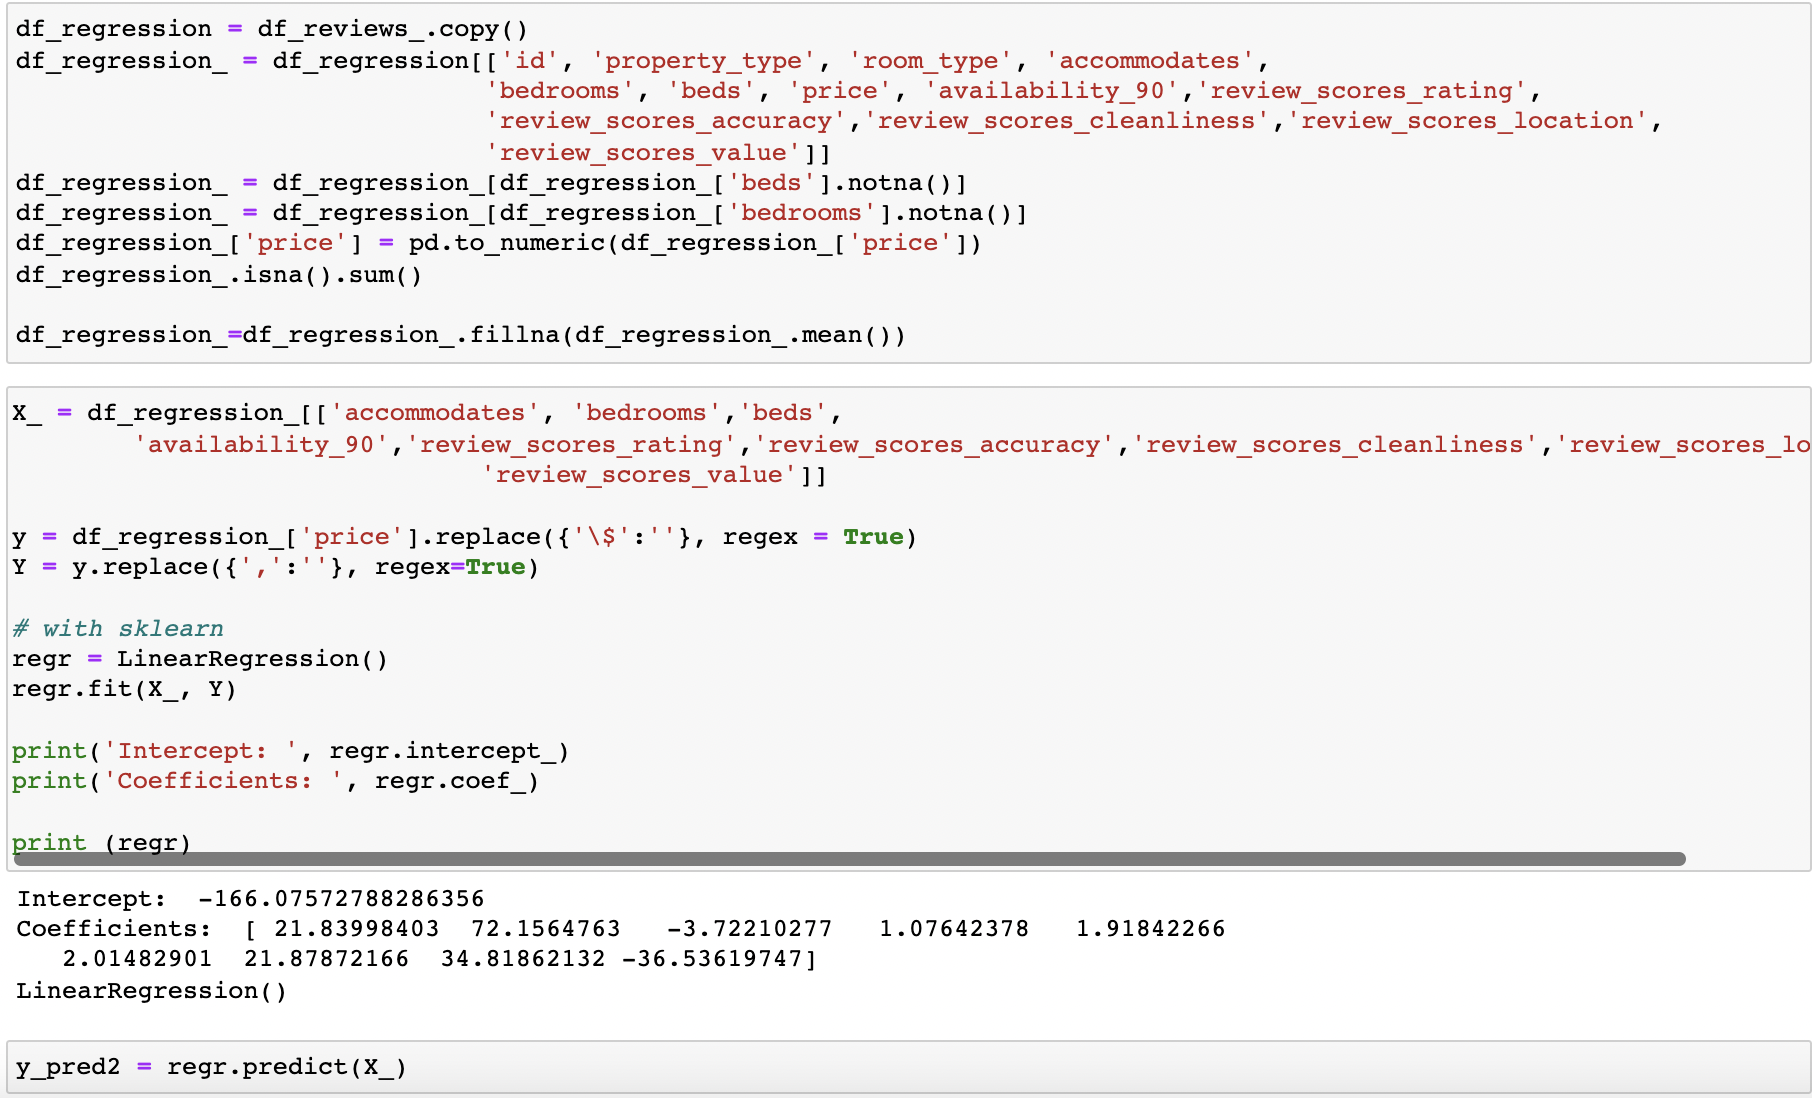
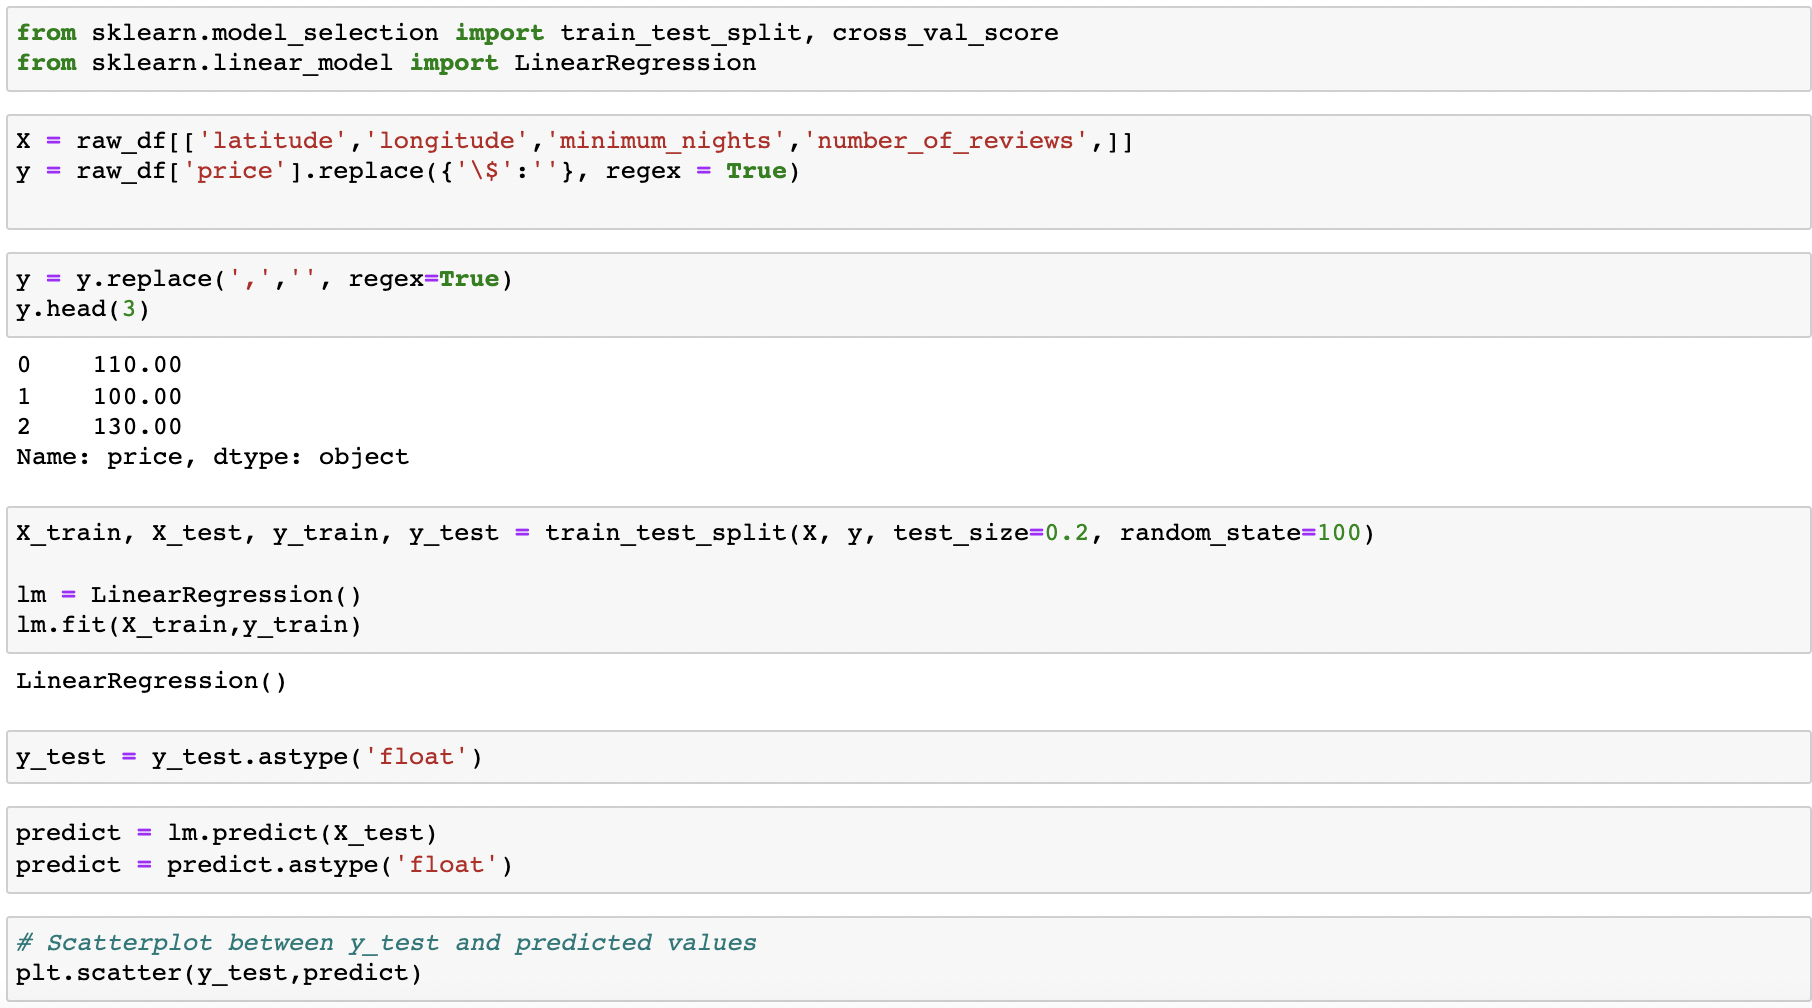
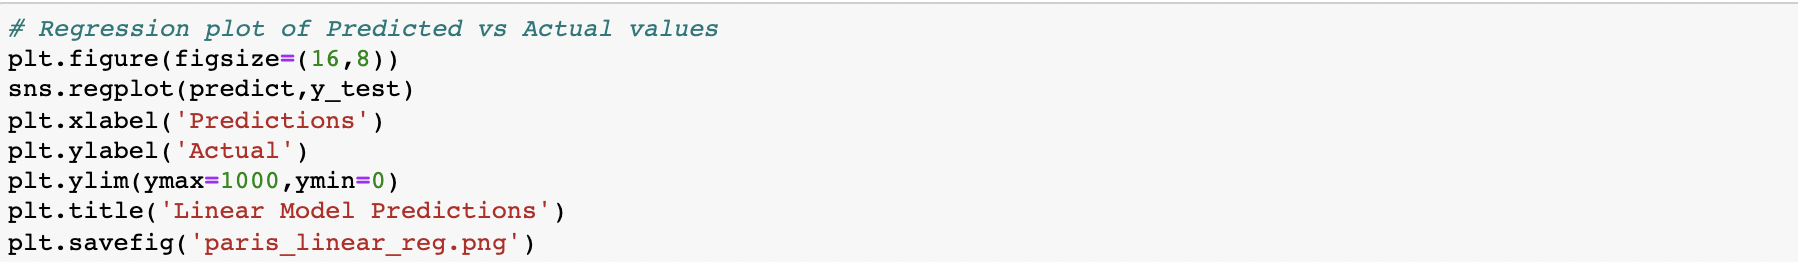
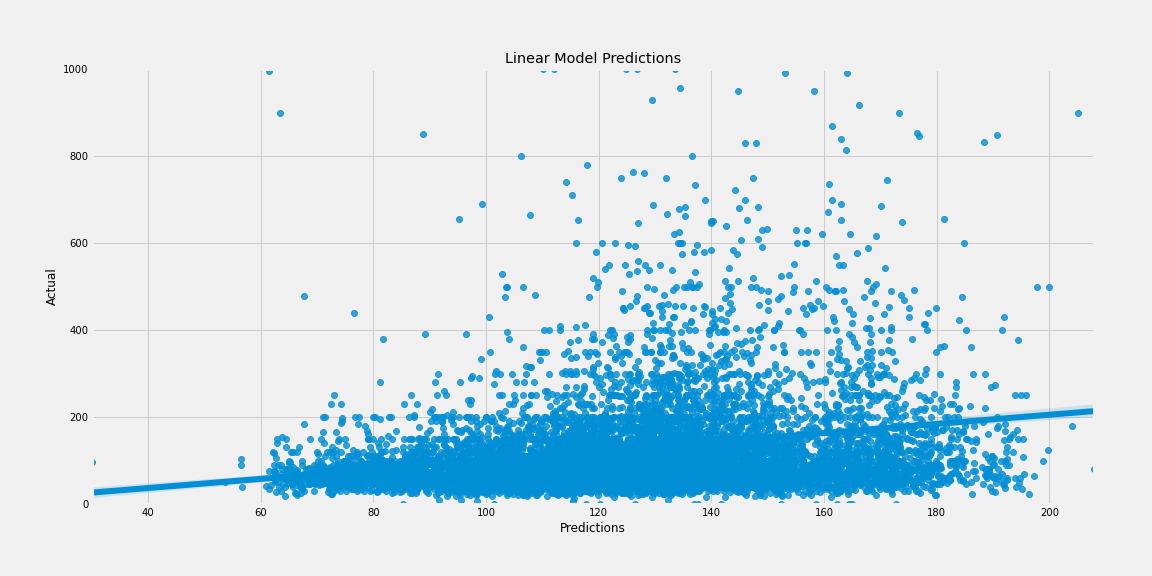
In order to predict the prices of each airbnb unit, I relied on regression analysis and the scikit-learn package. But in order to get to this step, I did a significant amount of data cleaning and pre-processing - please see the Appendix section for more detail. The key dependent variables I relied on for my regression analysis included # of accommodations, # of bedrooms, # of beds, availabiltiy in the past 90 days, and user review scores for accuracy, cleanliness, location, value, and overall experience. I ran several regressions for Paris (and all other European cities) with constraints for # of guests with the goal of predicting the expected price of the unit.
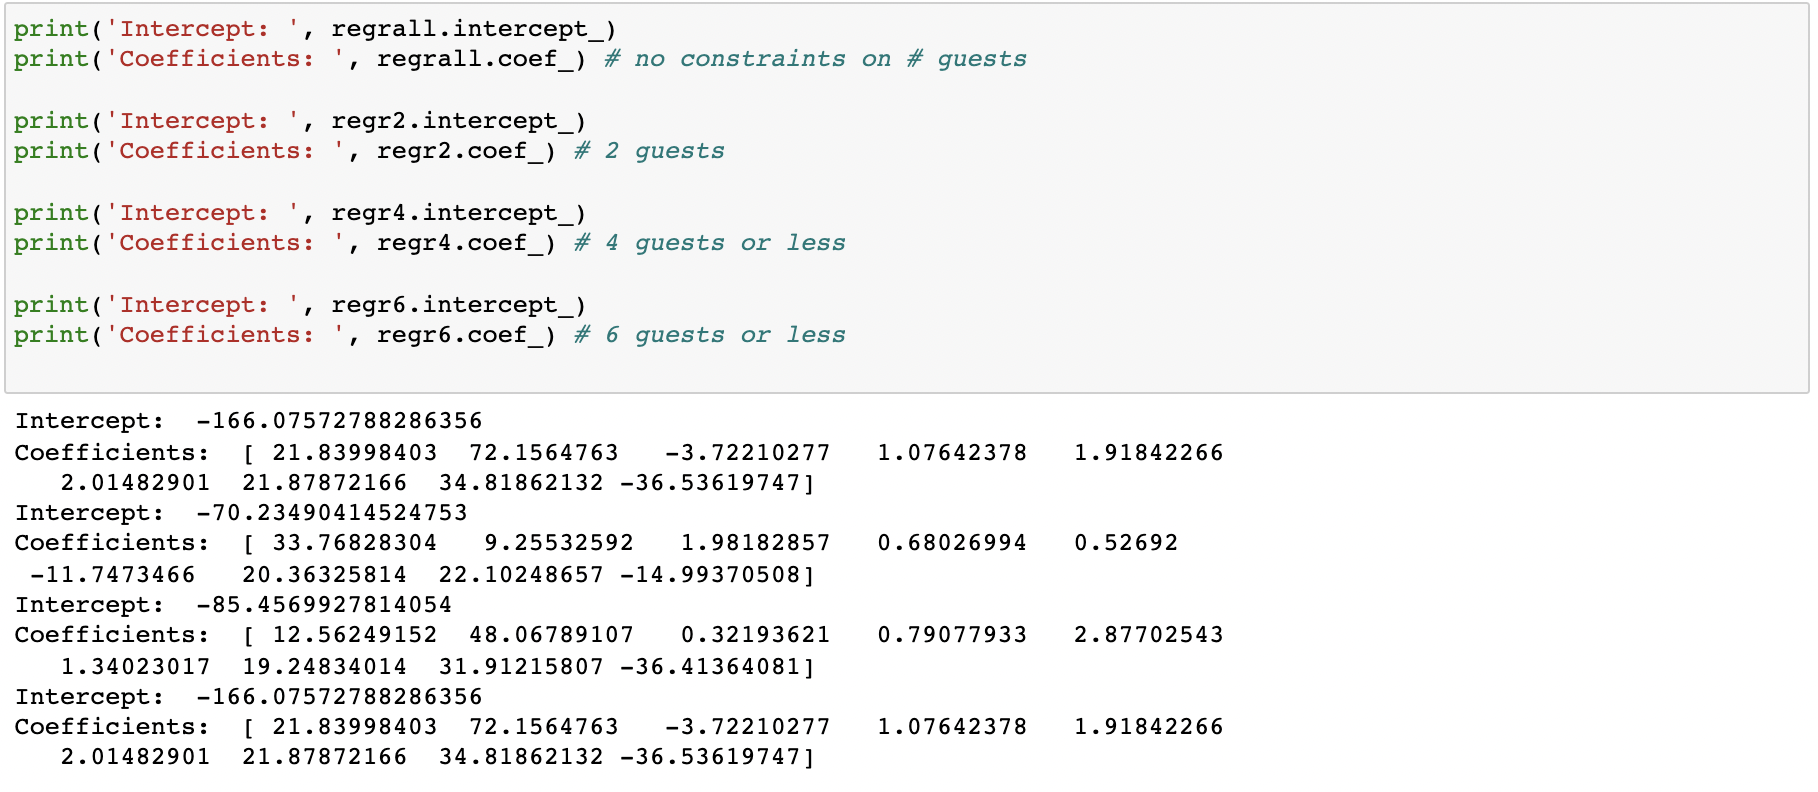
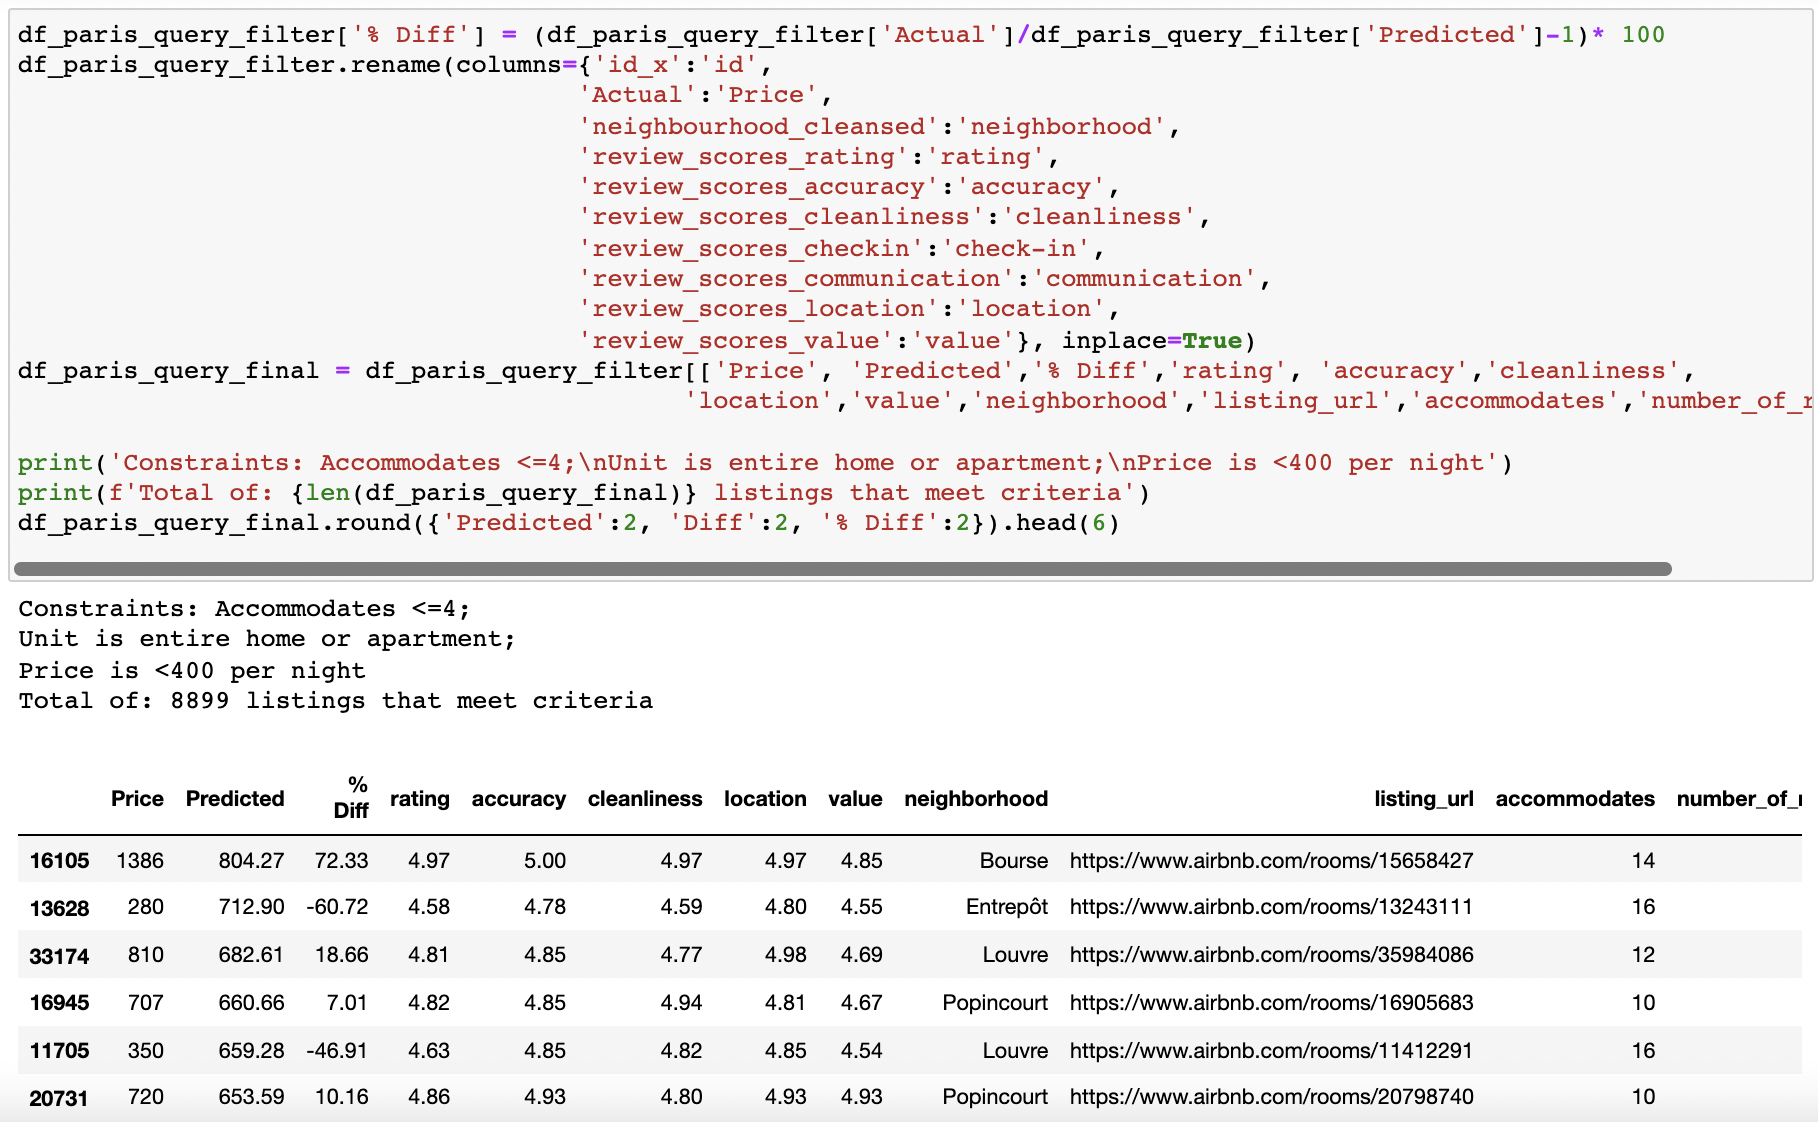
From there I was able to use the pandas 'query' function to find the highest predicted value units, taking into account published user reviews and various features such as # of accommodations, etc. See below for the top 5 highest expected nightly prices. It makes intuitive sense that the predicted price is positively correlated with # of guests and # of bedrooms/beds. Higher scores tend to also be positively correlated with better review scores, but the # of reviews and length of available duration does have an indiscriminant effect on the predicted price. It's also important to point out that certain optional features such as 'instant bookable' and 'super hosts' resulted in higher predicted prices. The presence of advertised amenities such as 'air conditioning', 'internet connectivity' and 'tv', among others, were also postively correlated to price.
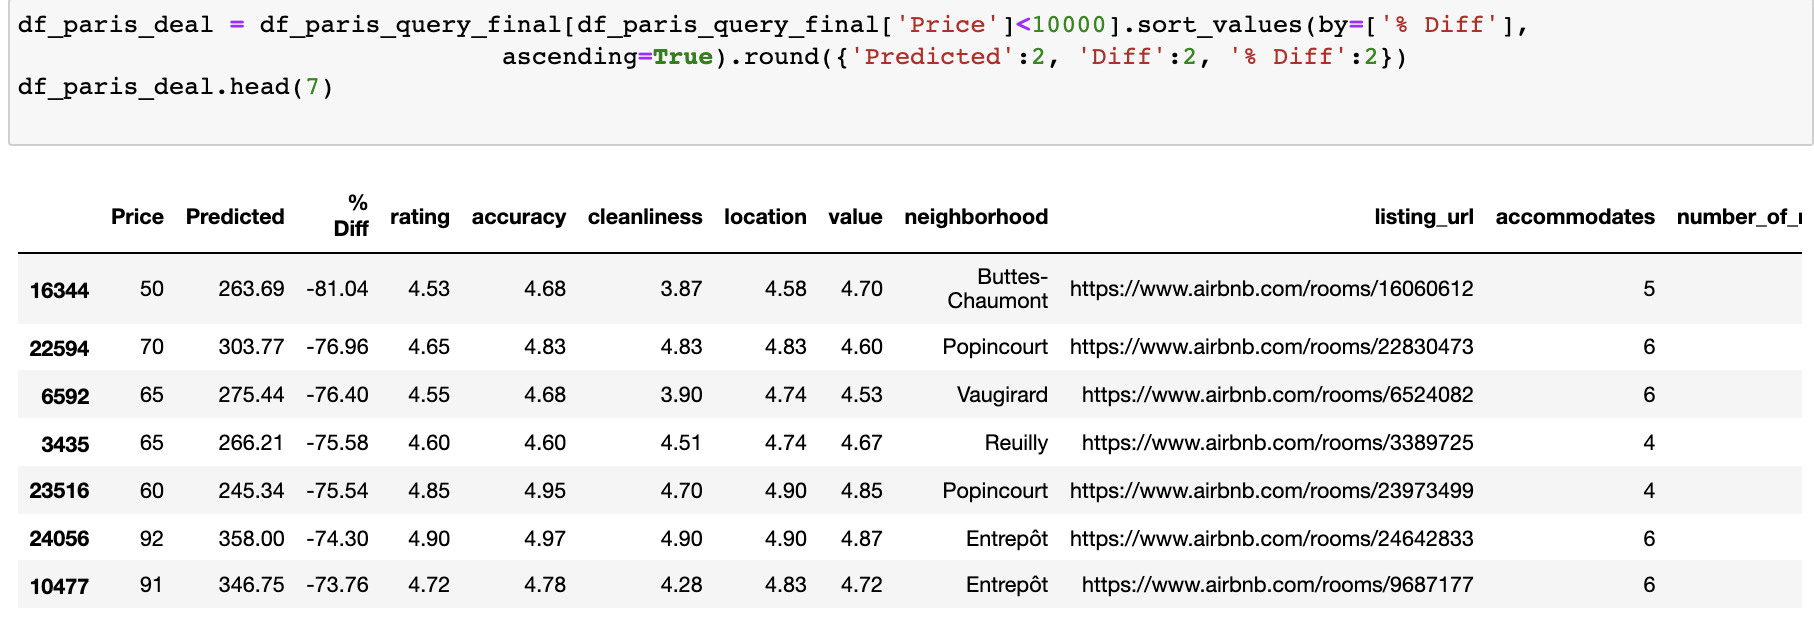
For those seeking more affordability and better value, I was also able to identify the biggest gap between predicted price based on the regression, and listed price:
Exploratory data analysis
As part of my analysis and before using sci-kit learn to run predict nightly prices, I conducted some exploraory data analysis on my dataset. My analysis falls into a few themes and was largely dictated by the type of variables. Below I show code and analysis for time series data, numerical data, categorical variable and boolean features.
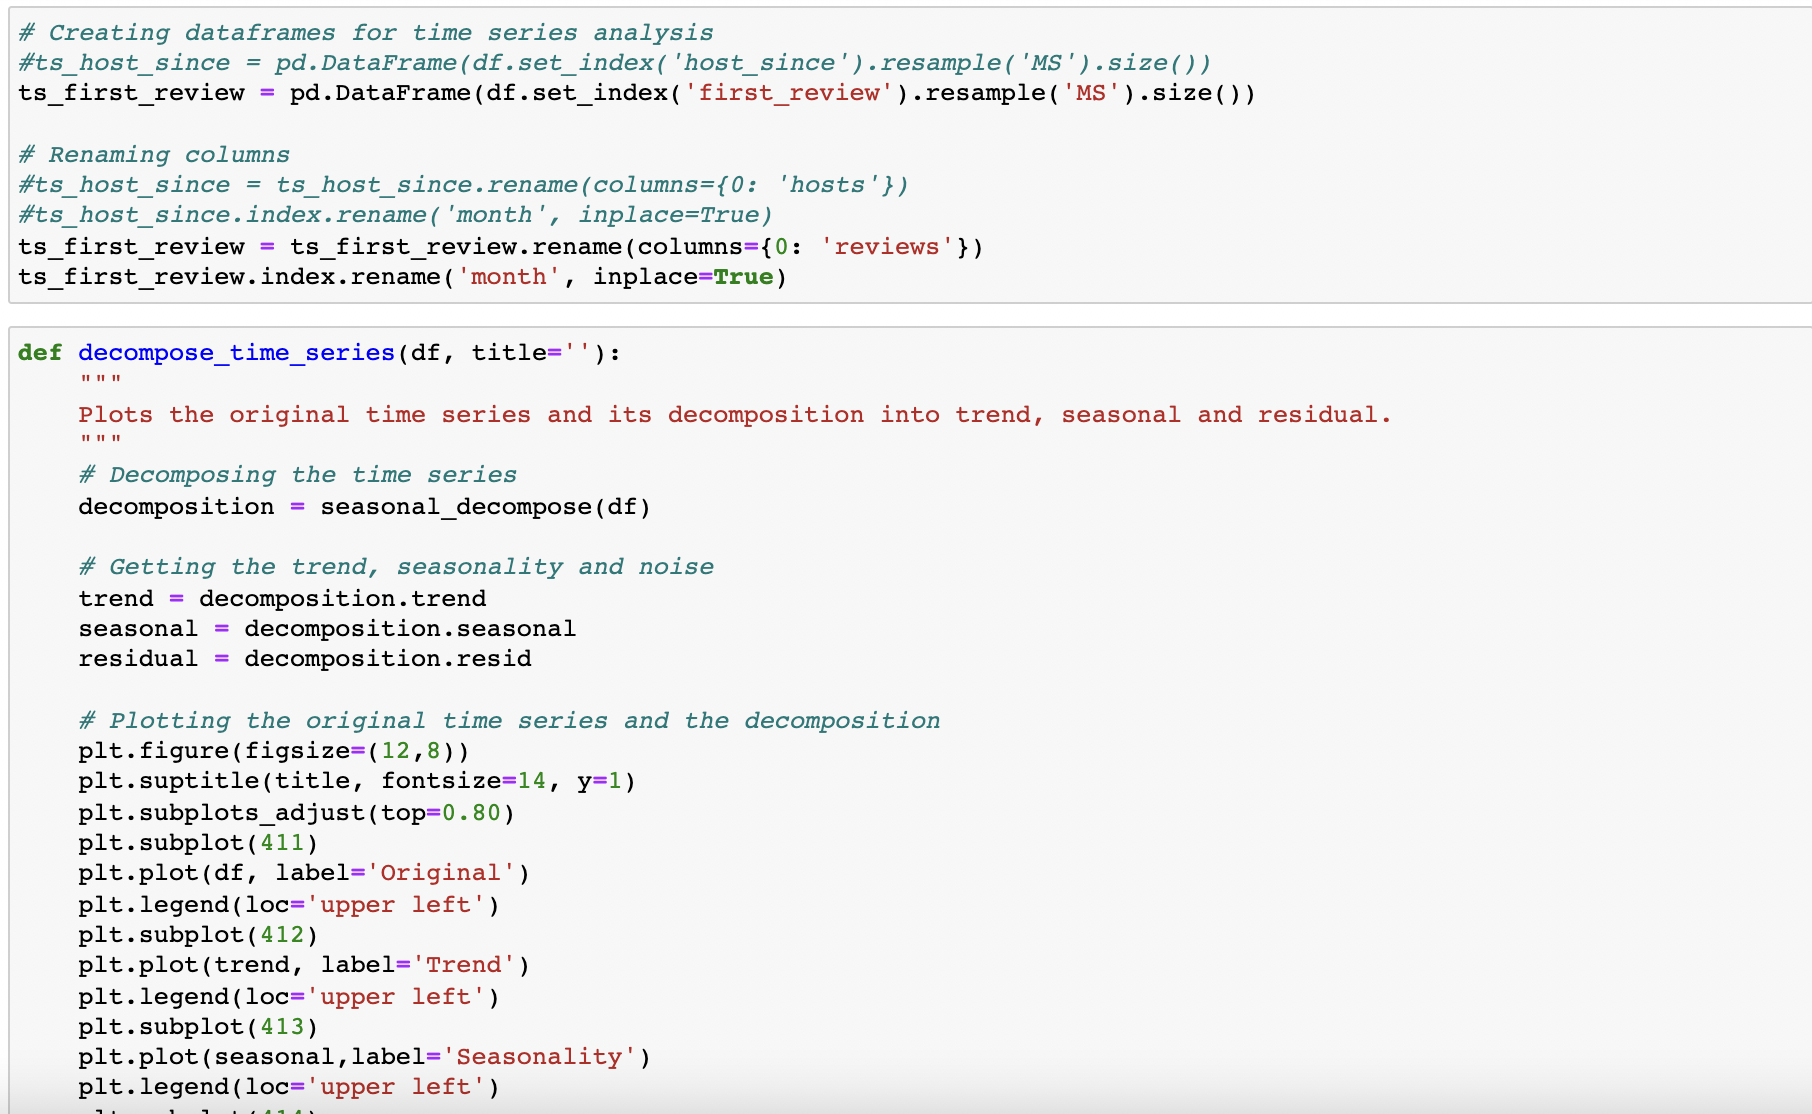
Time Series
Observations:
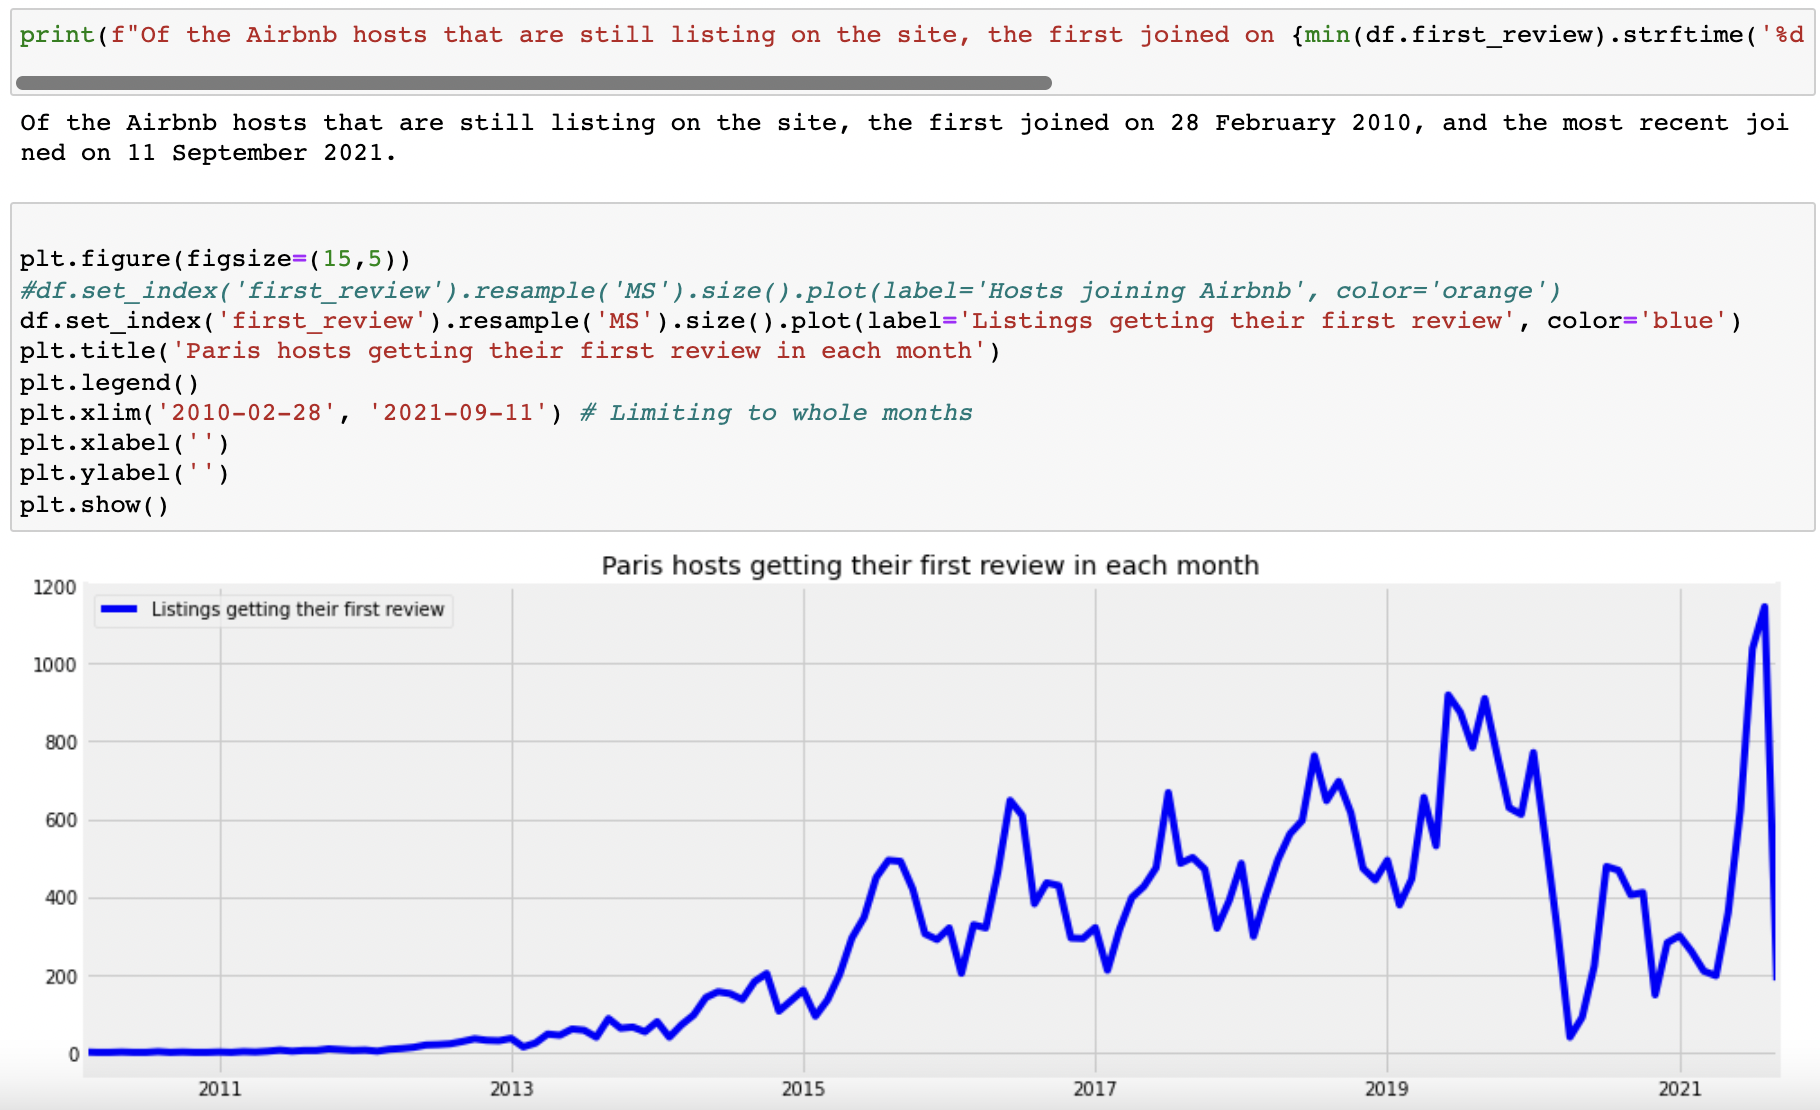
- Of the Airbnb hosts still listing on the site, the earliest host that joined did so on February 28, 2010, and the most recent new host joined September 11, 2021 (note the data was initially scraped in September 2021).
- The outbreak of COVID-19 had a massive impact on new hosts, availability of units, nightly pricing, and ultimately the entire Airbnb company business model. For safety concerns Airbnb was forced to stop hosting guests (and did make efforts to generate additional revenue streams through virtual experiences).
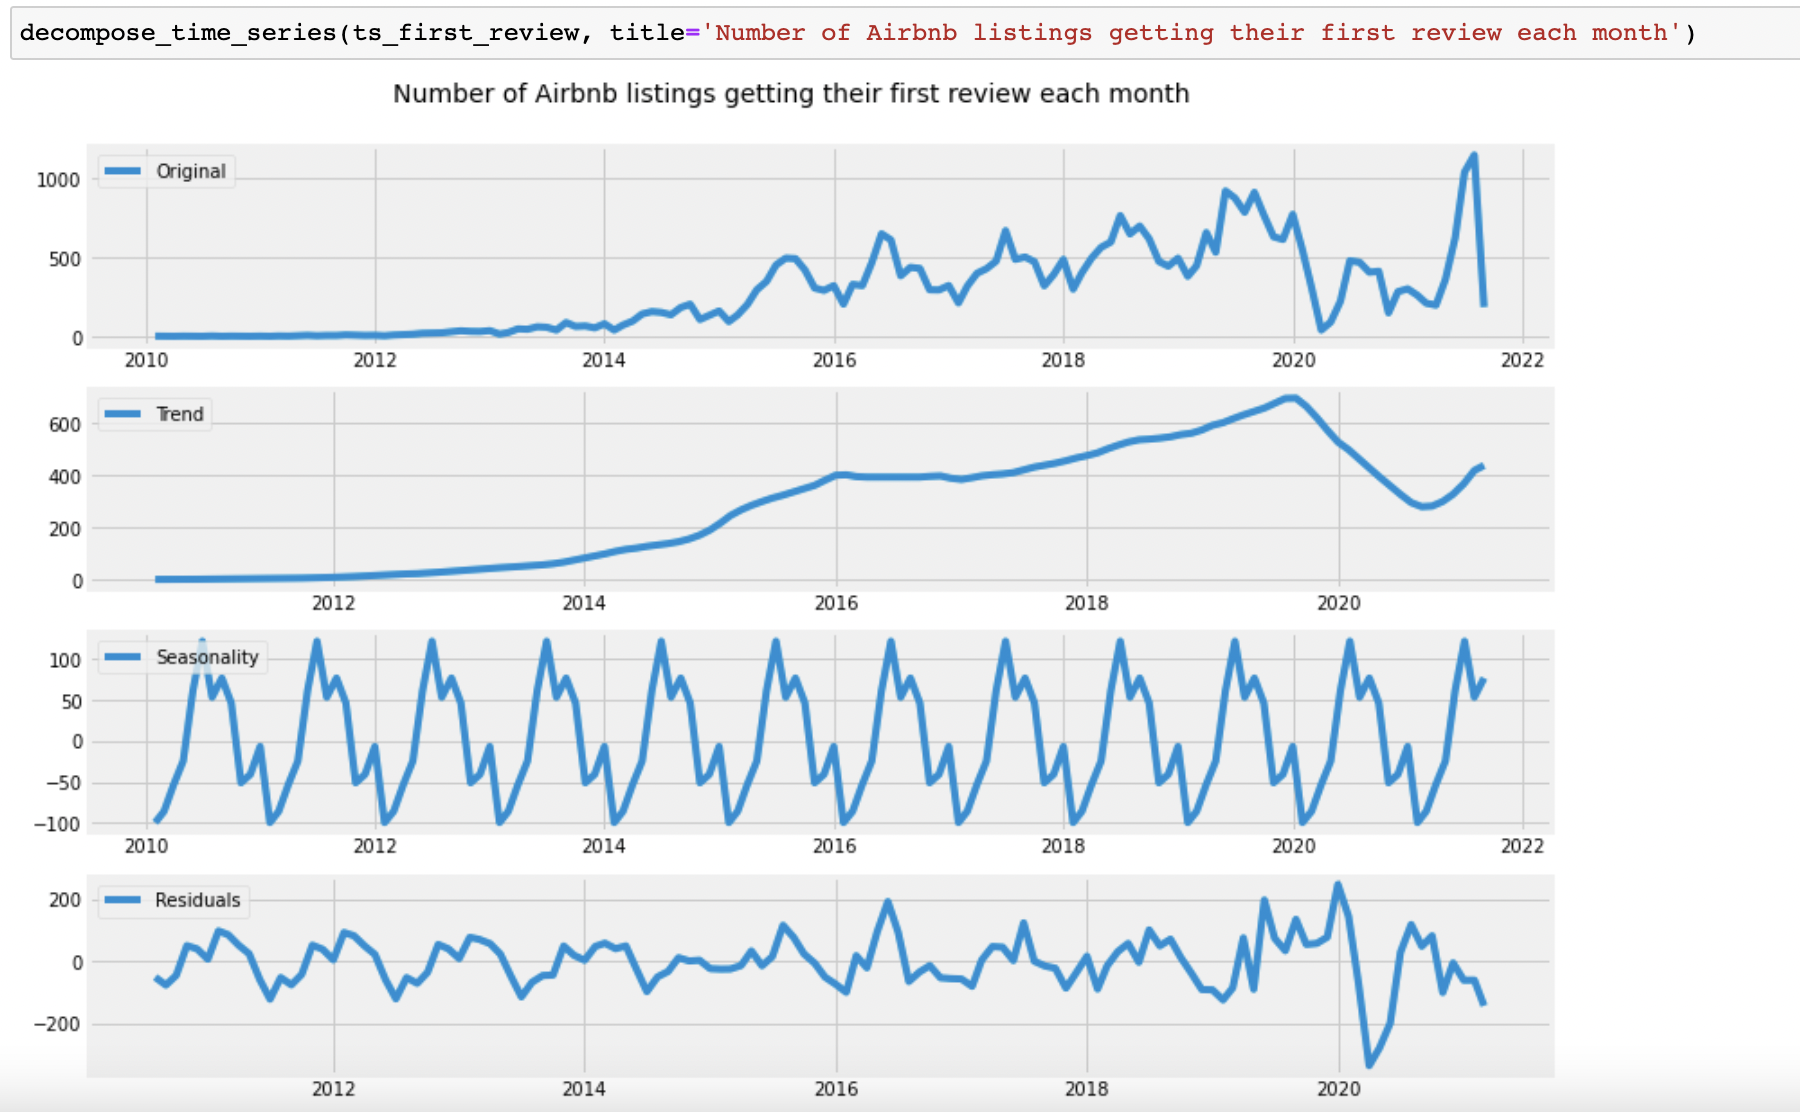
- Seasonal decompostion analysis shows a repeating pattern, with steady gains in # of listings from 2014 and each year into 2020. The frequency of bookings coincided with the European vacation schedule, where many Parisians leave the city in August. Bookings also spiked toward the end of the year around holdiay season where demand is higher.
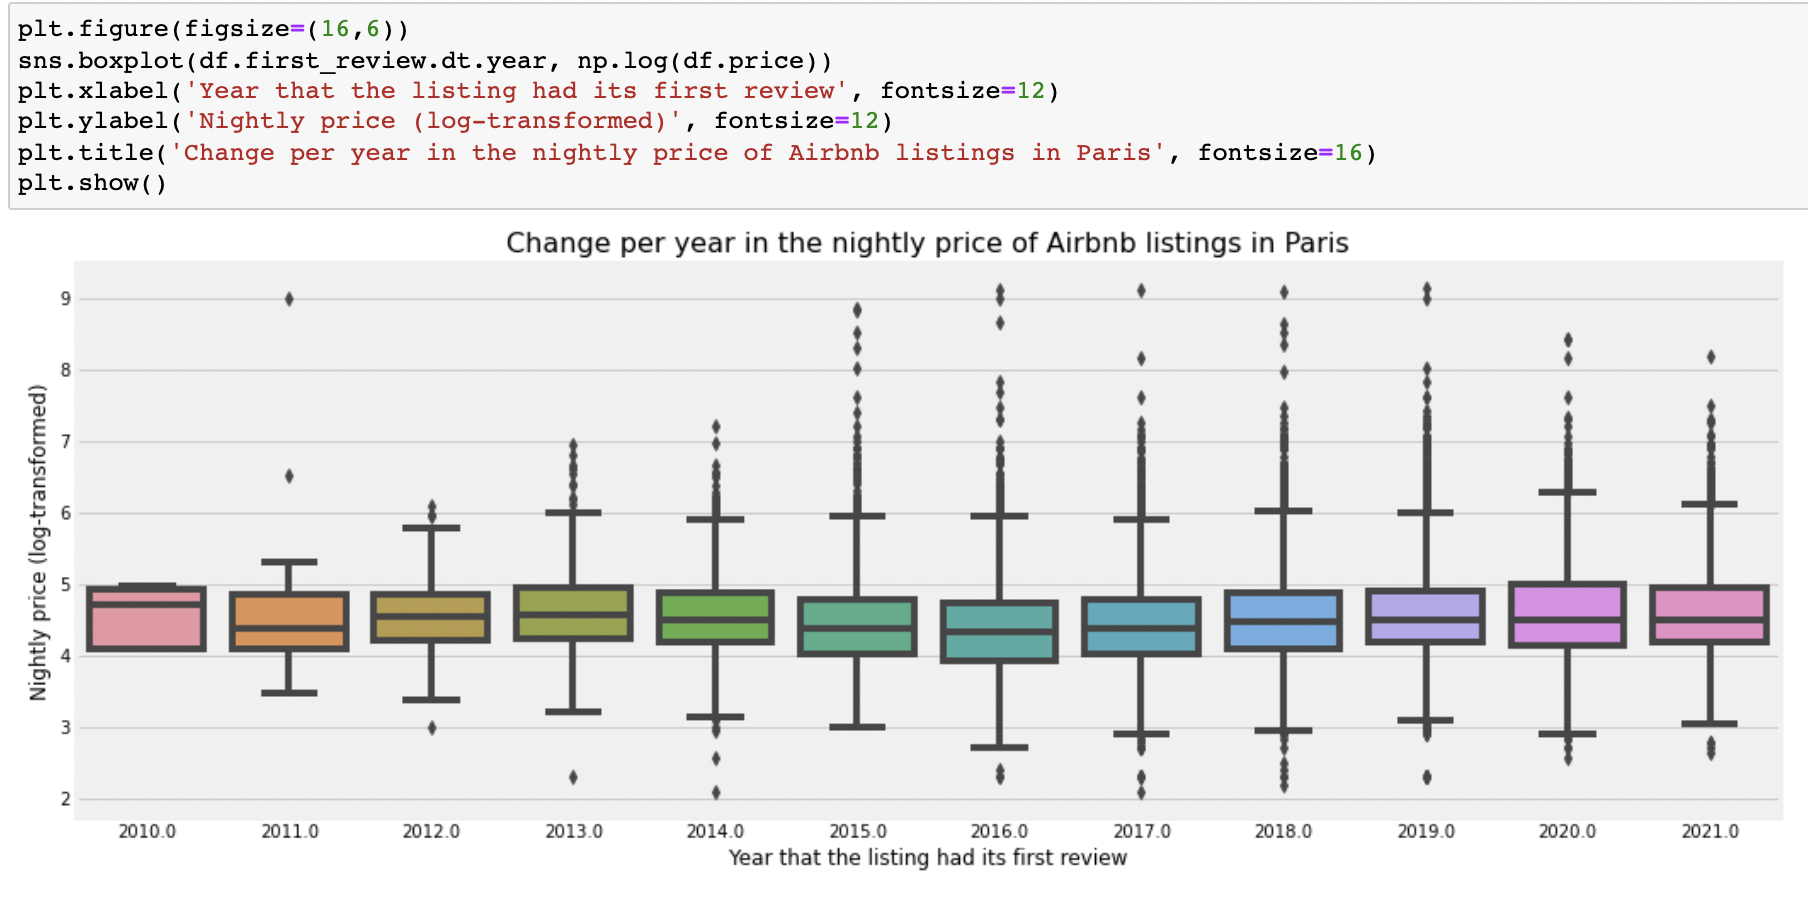
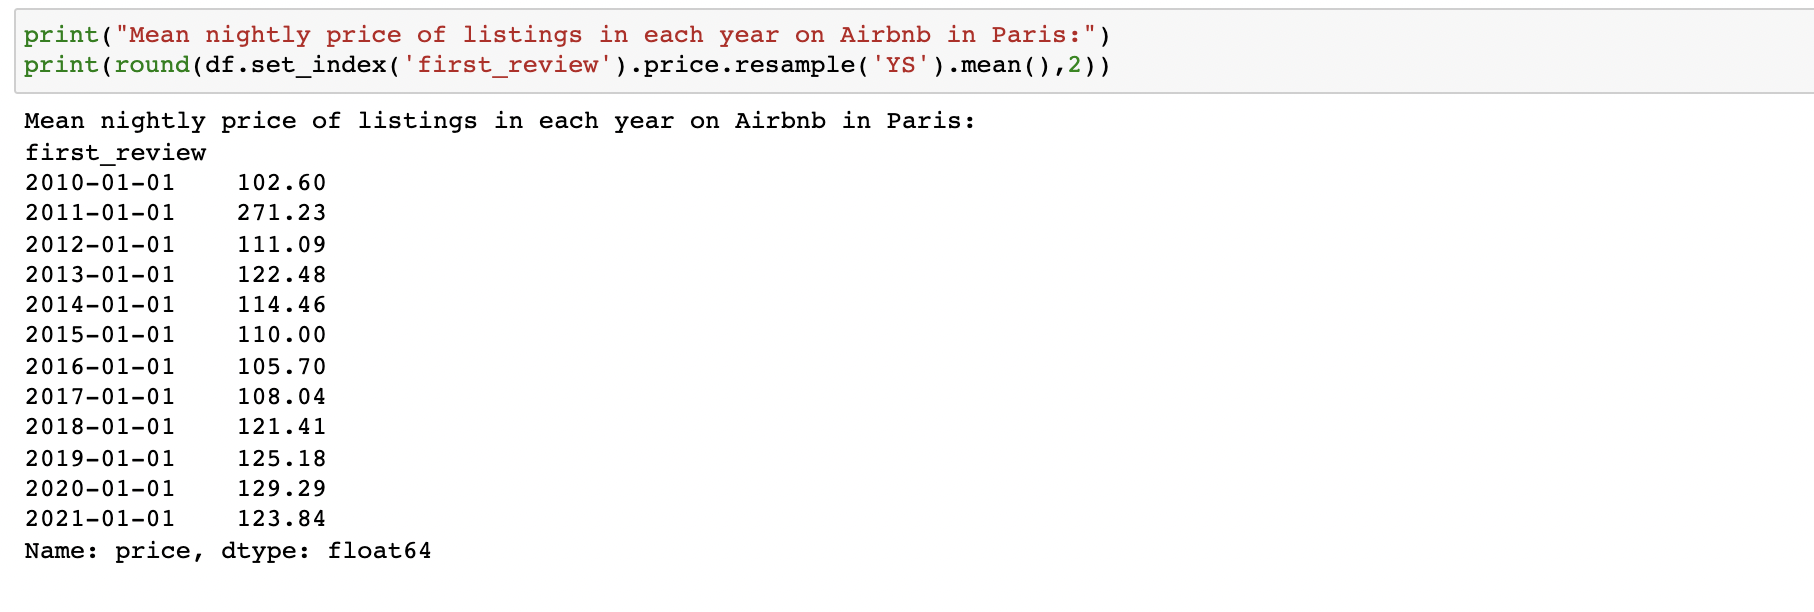
- Pricing power is pretty under-stated on the platform, and a lot of this might have to do with increased regulatory scrutiny. Airbnb is very heavily scrutinized by the Parisian government, much more so than other cities.
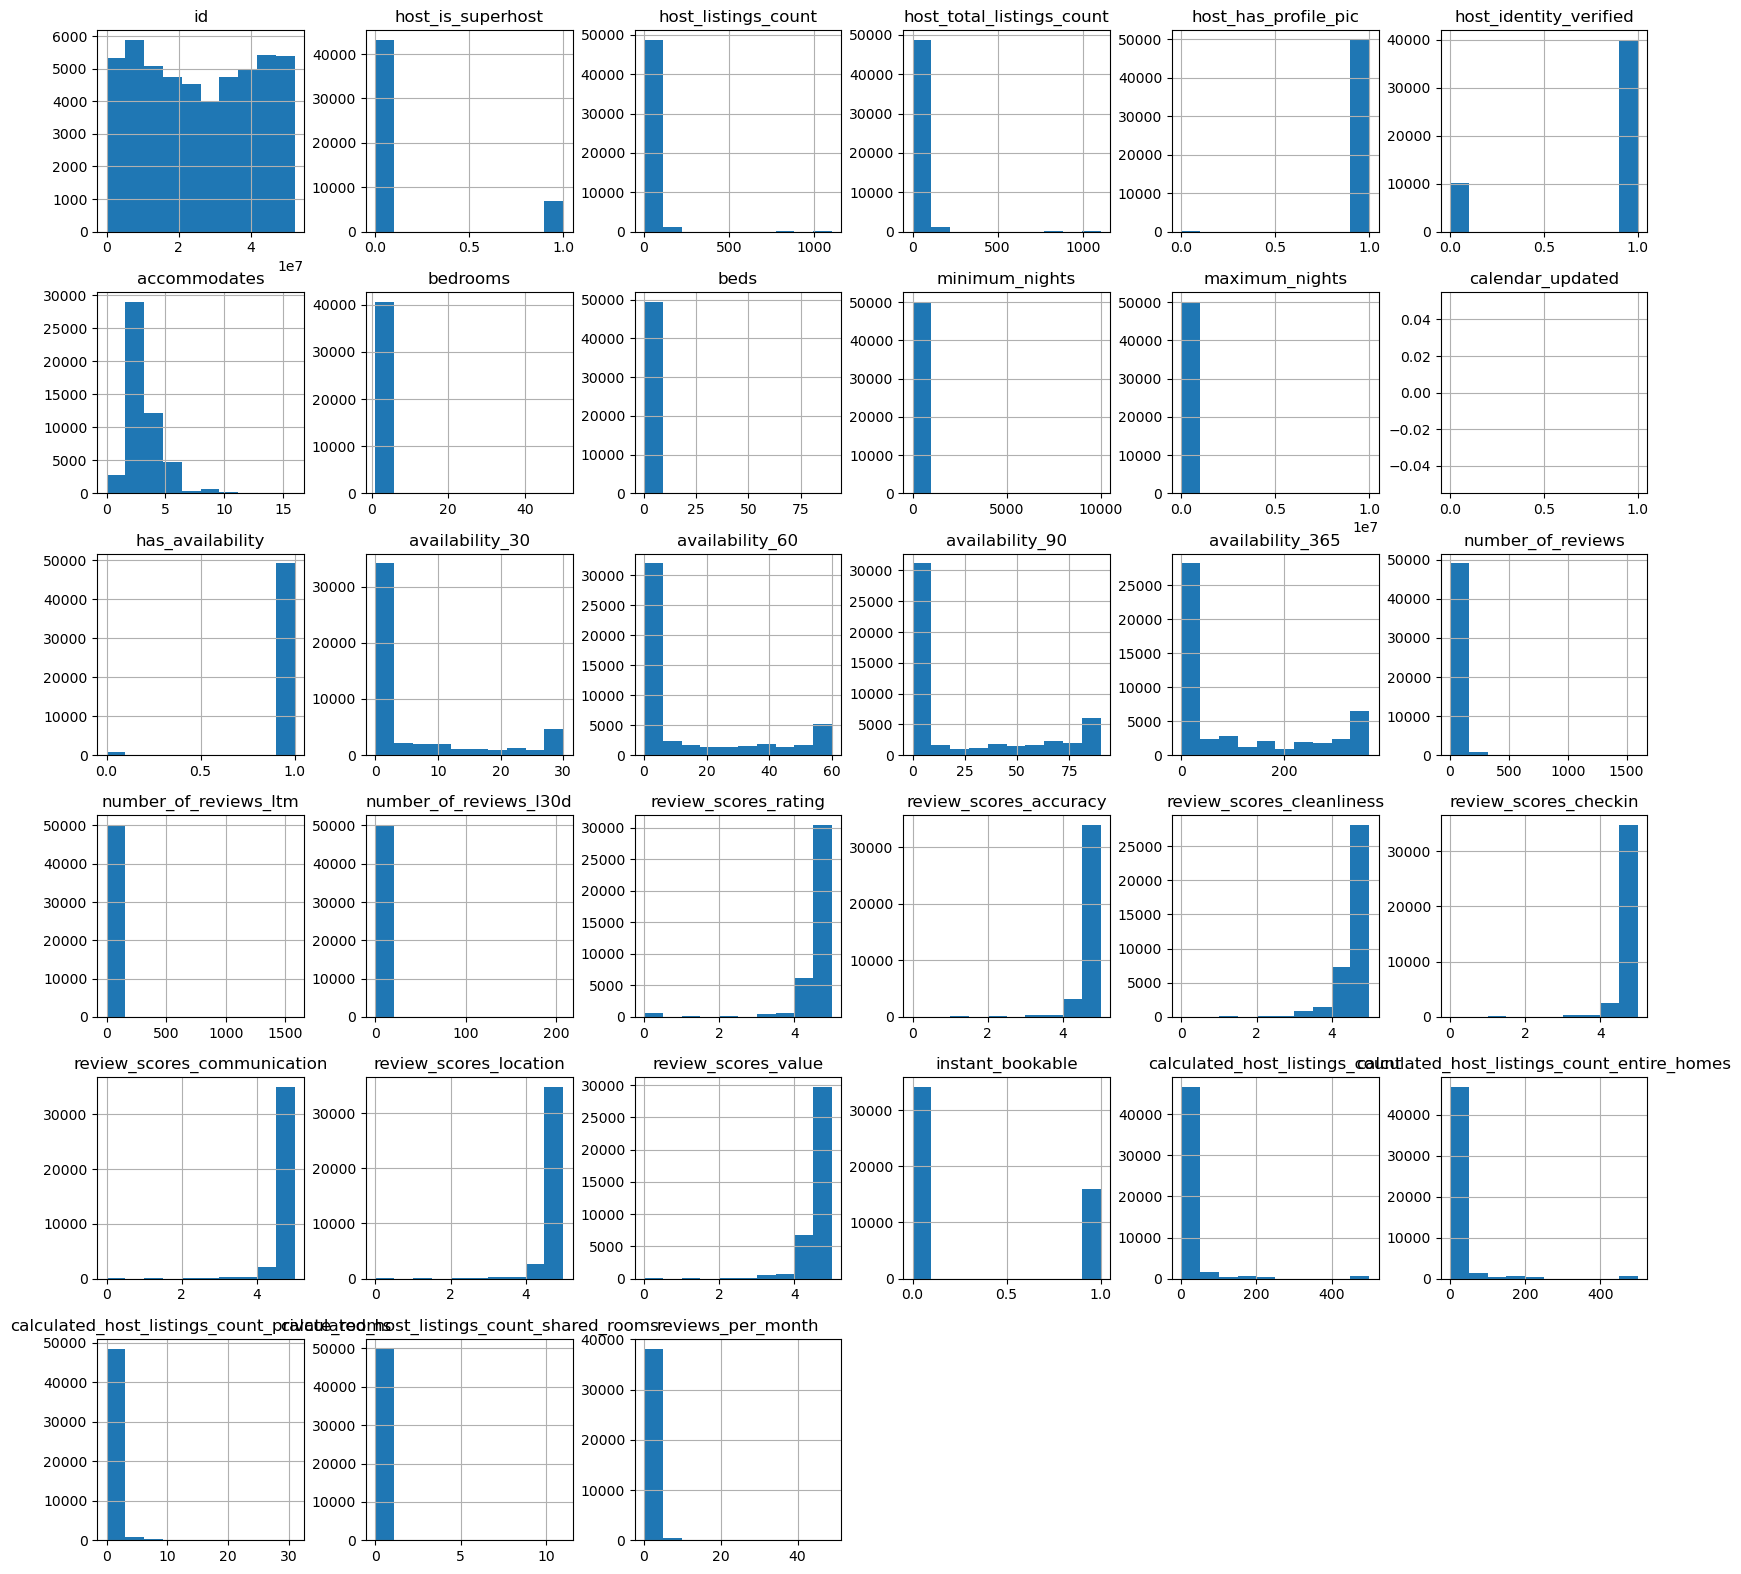
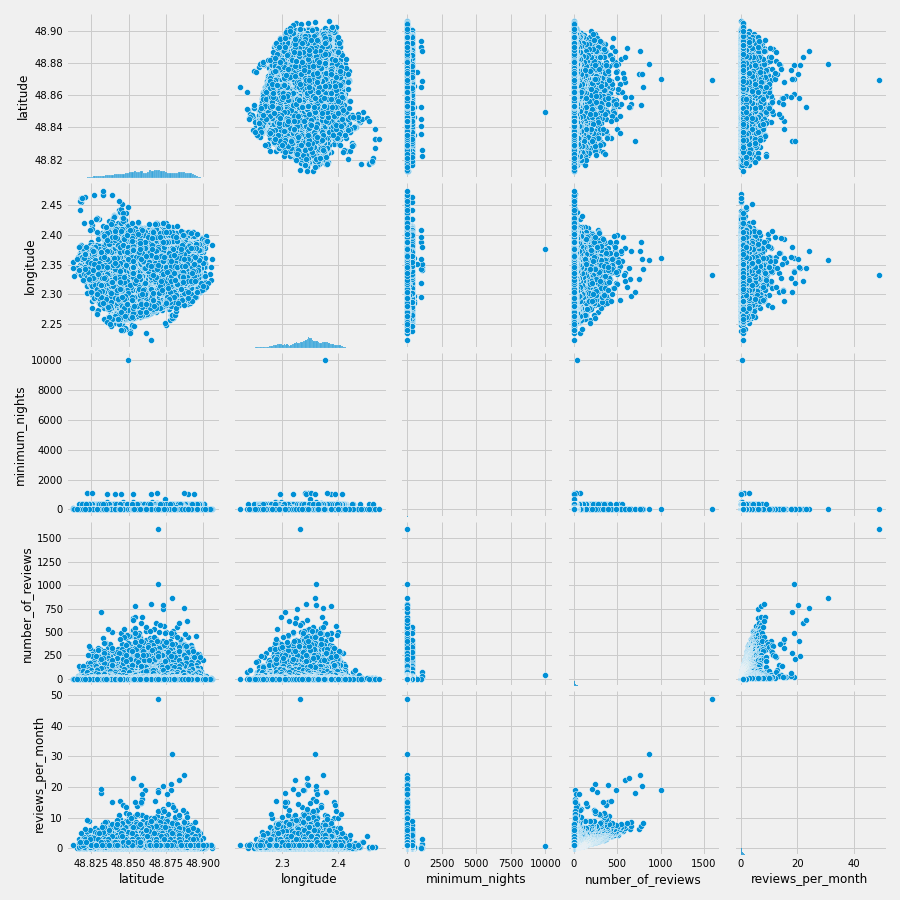
Numerical features
Observations:
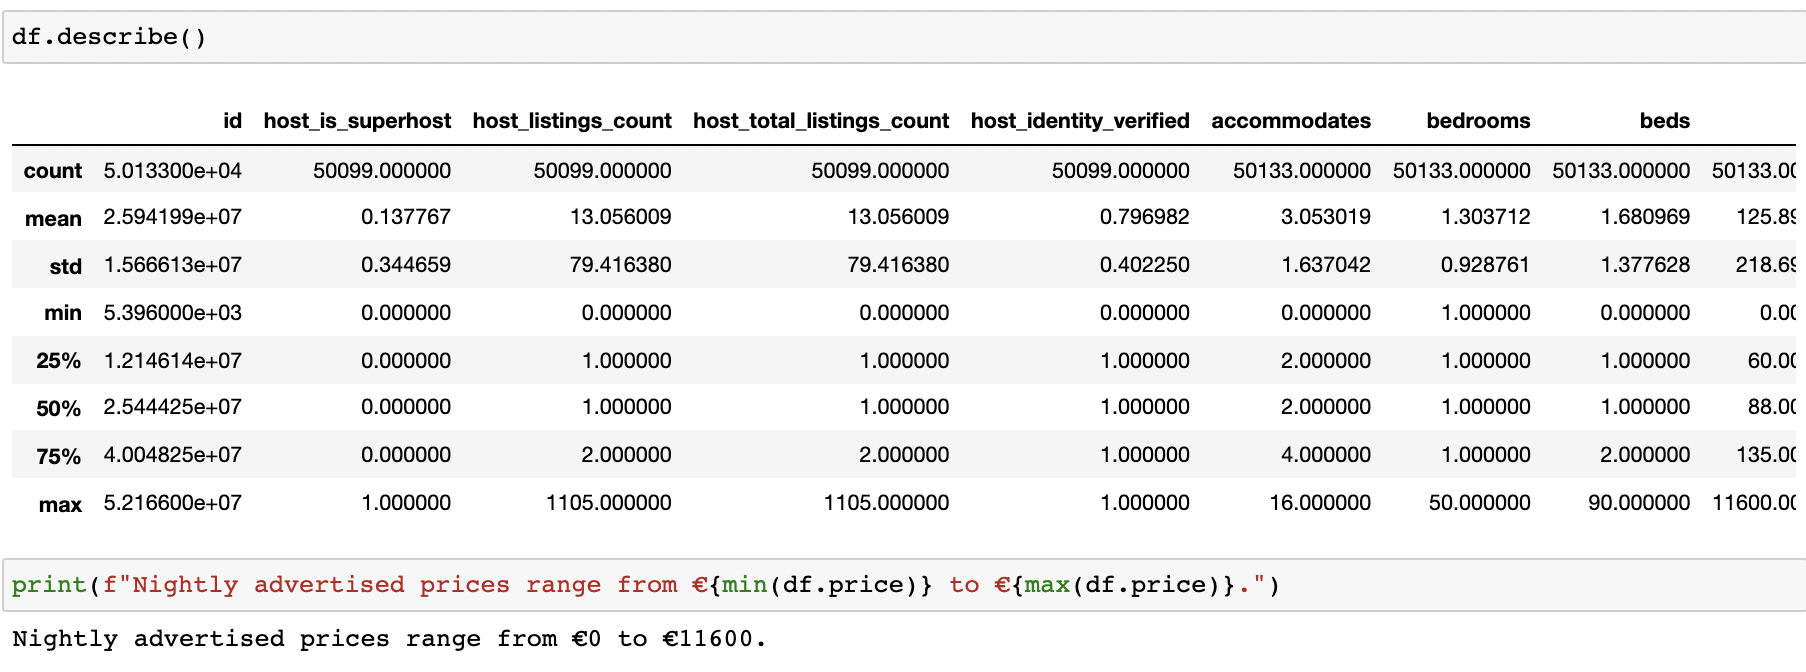
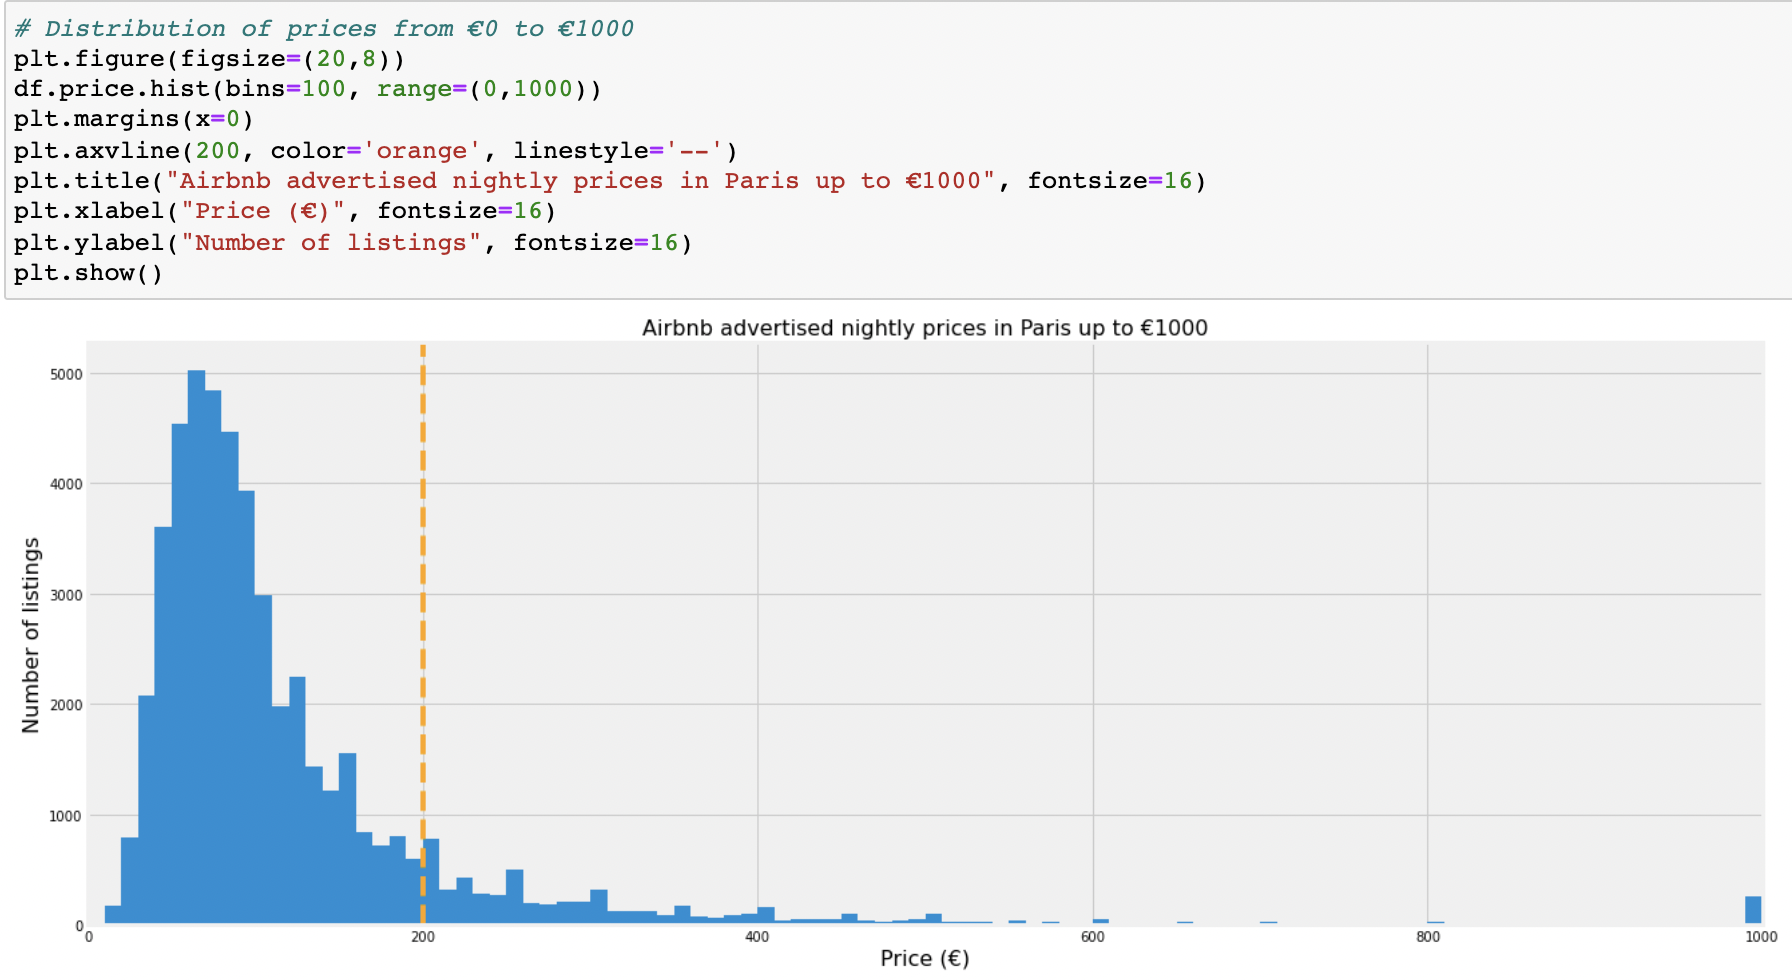
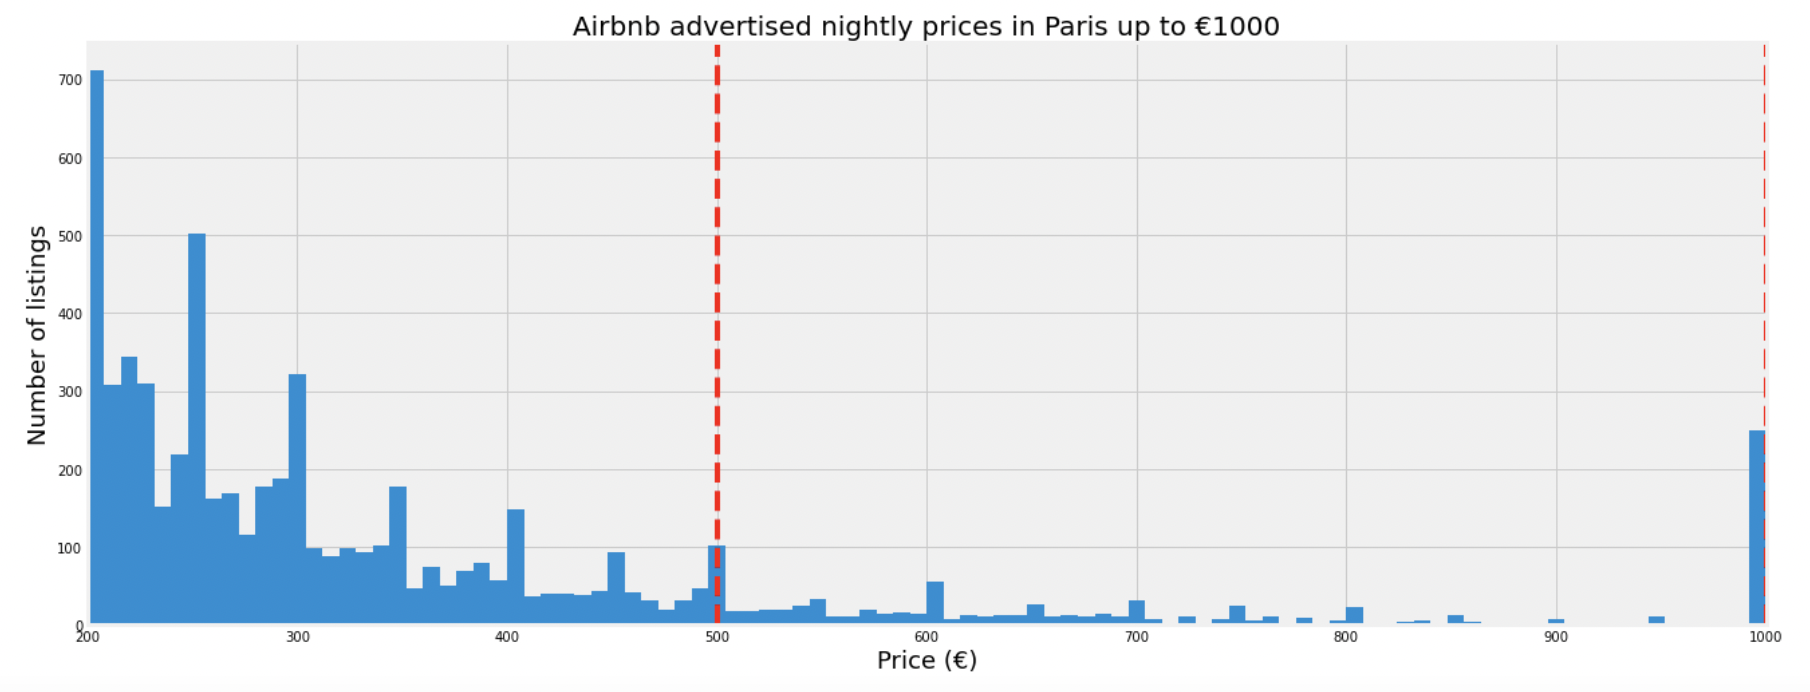
- Nightly advertised prices ranged from 0 to 11,600 per night (for my analysis I did remove null values). The majority of prices were under 300 per night, but there did exit some outliers.
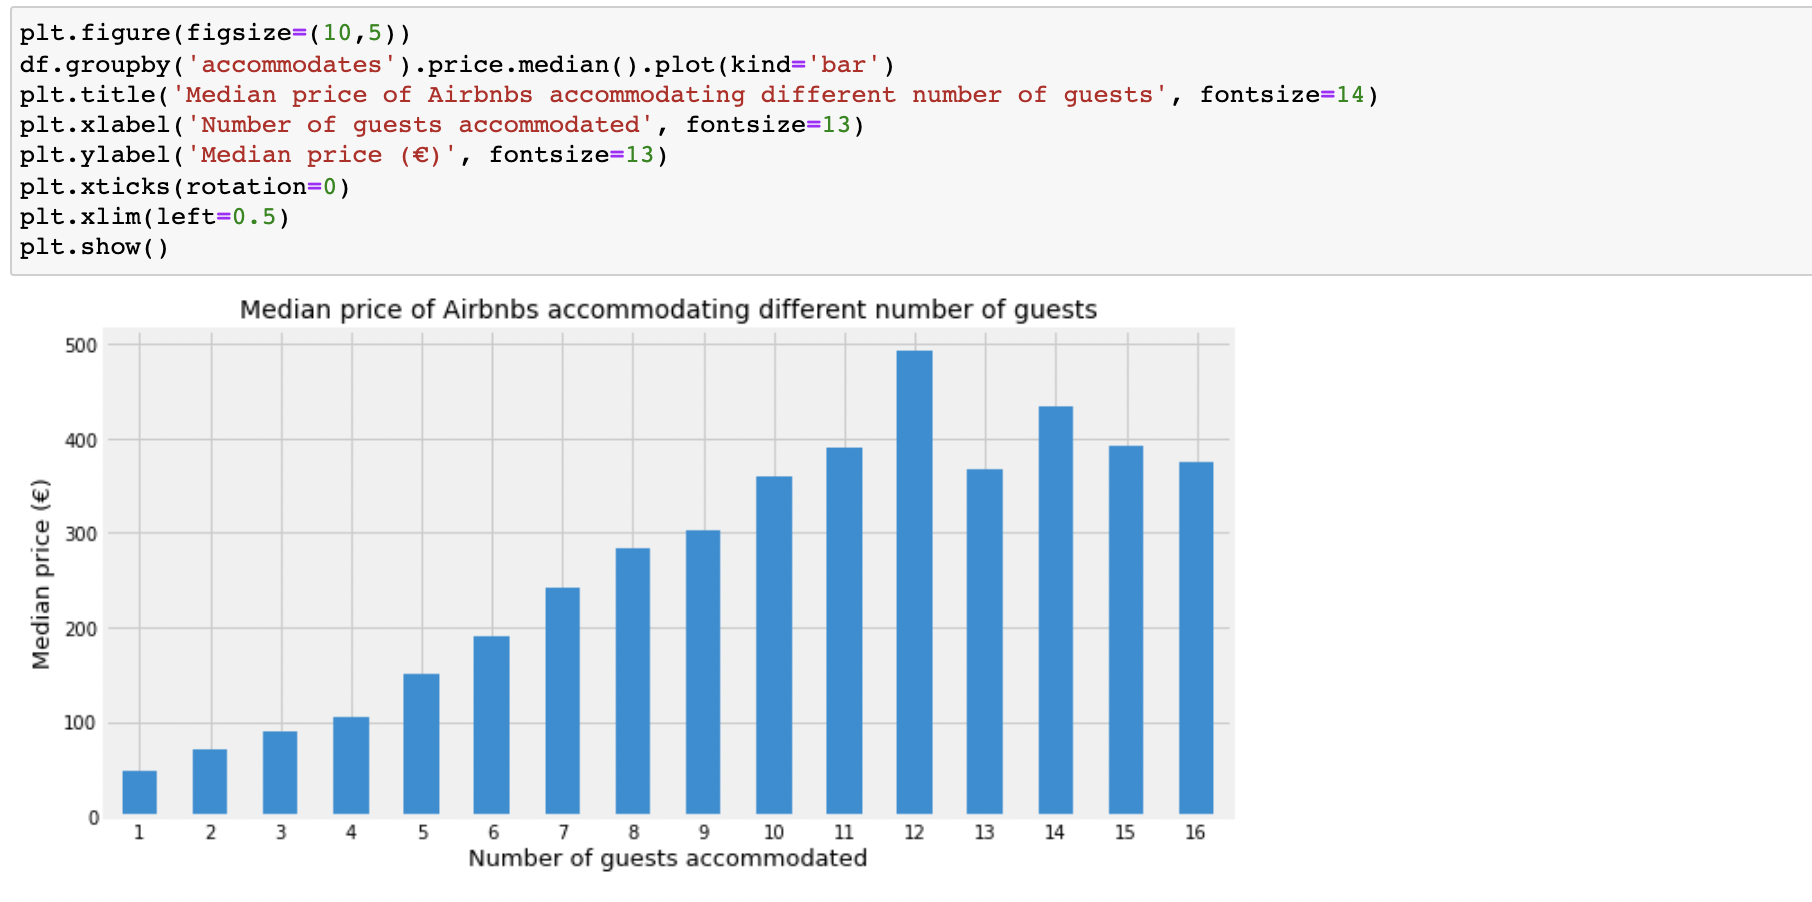
- Median nightly prices generally increased with an increase in number of guests that a unit accommodated. Interestingly, median pricing did peak at 12 guests and then started to decline. This may be due to some mislabeling of data (ex: it's possible that some units that accommodated a higher # of guests are actually hostels, and as a result median pricing experienced downward pressure).
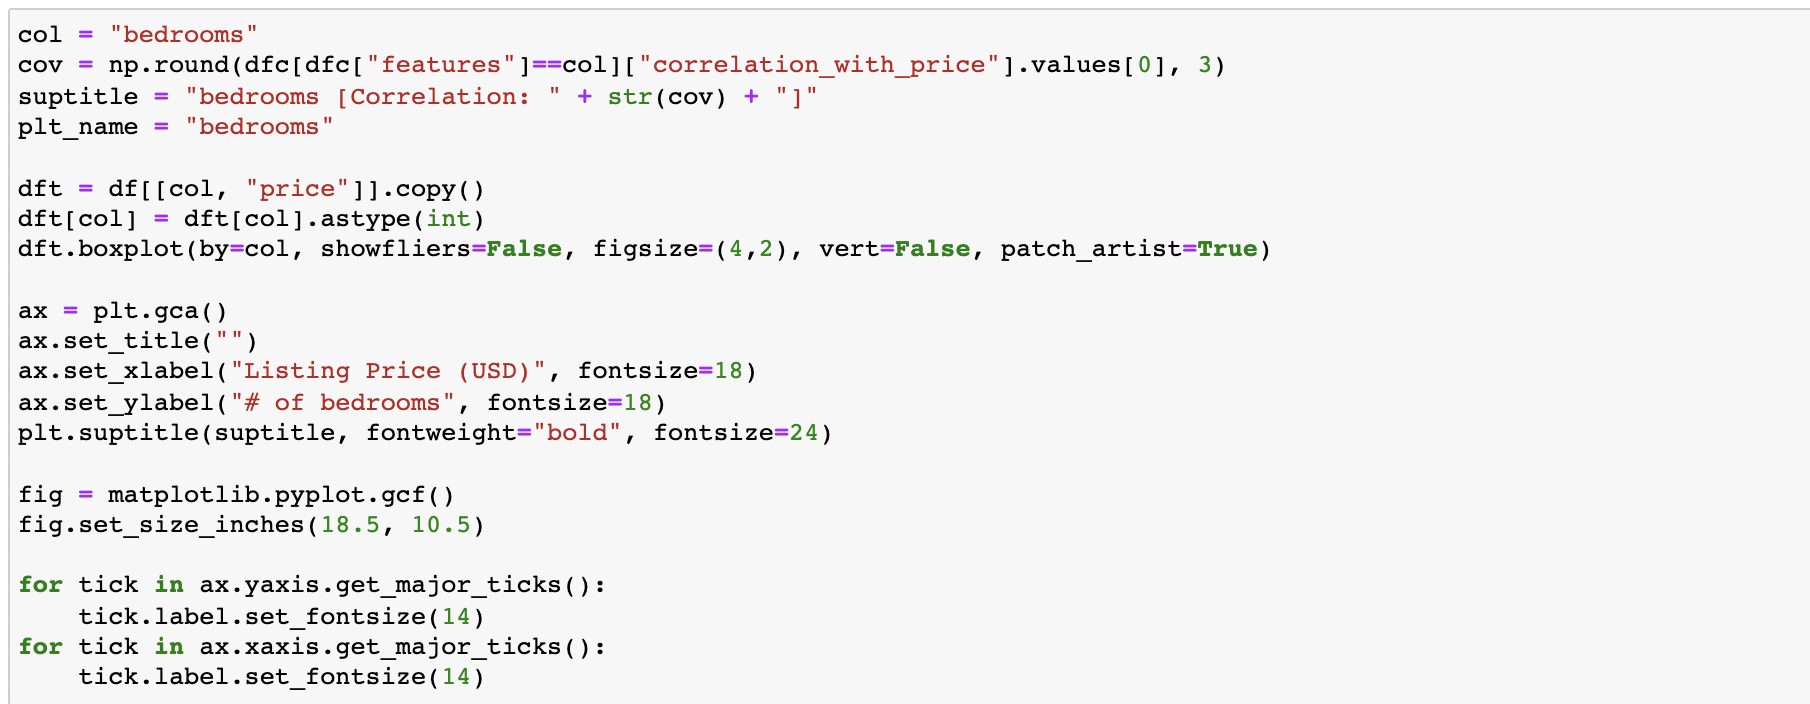
Categorical features
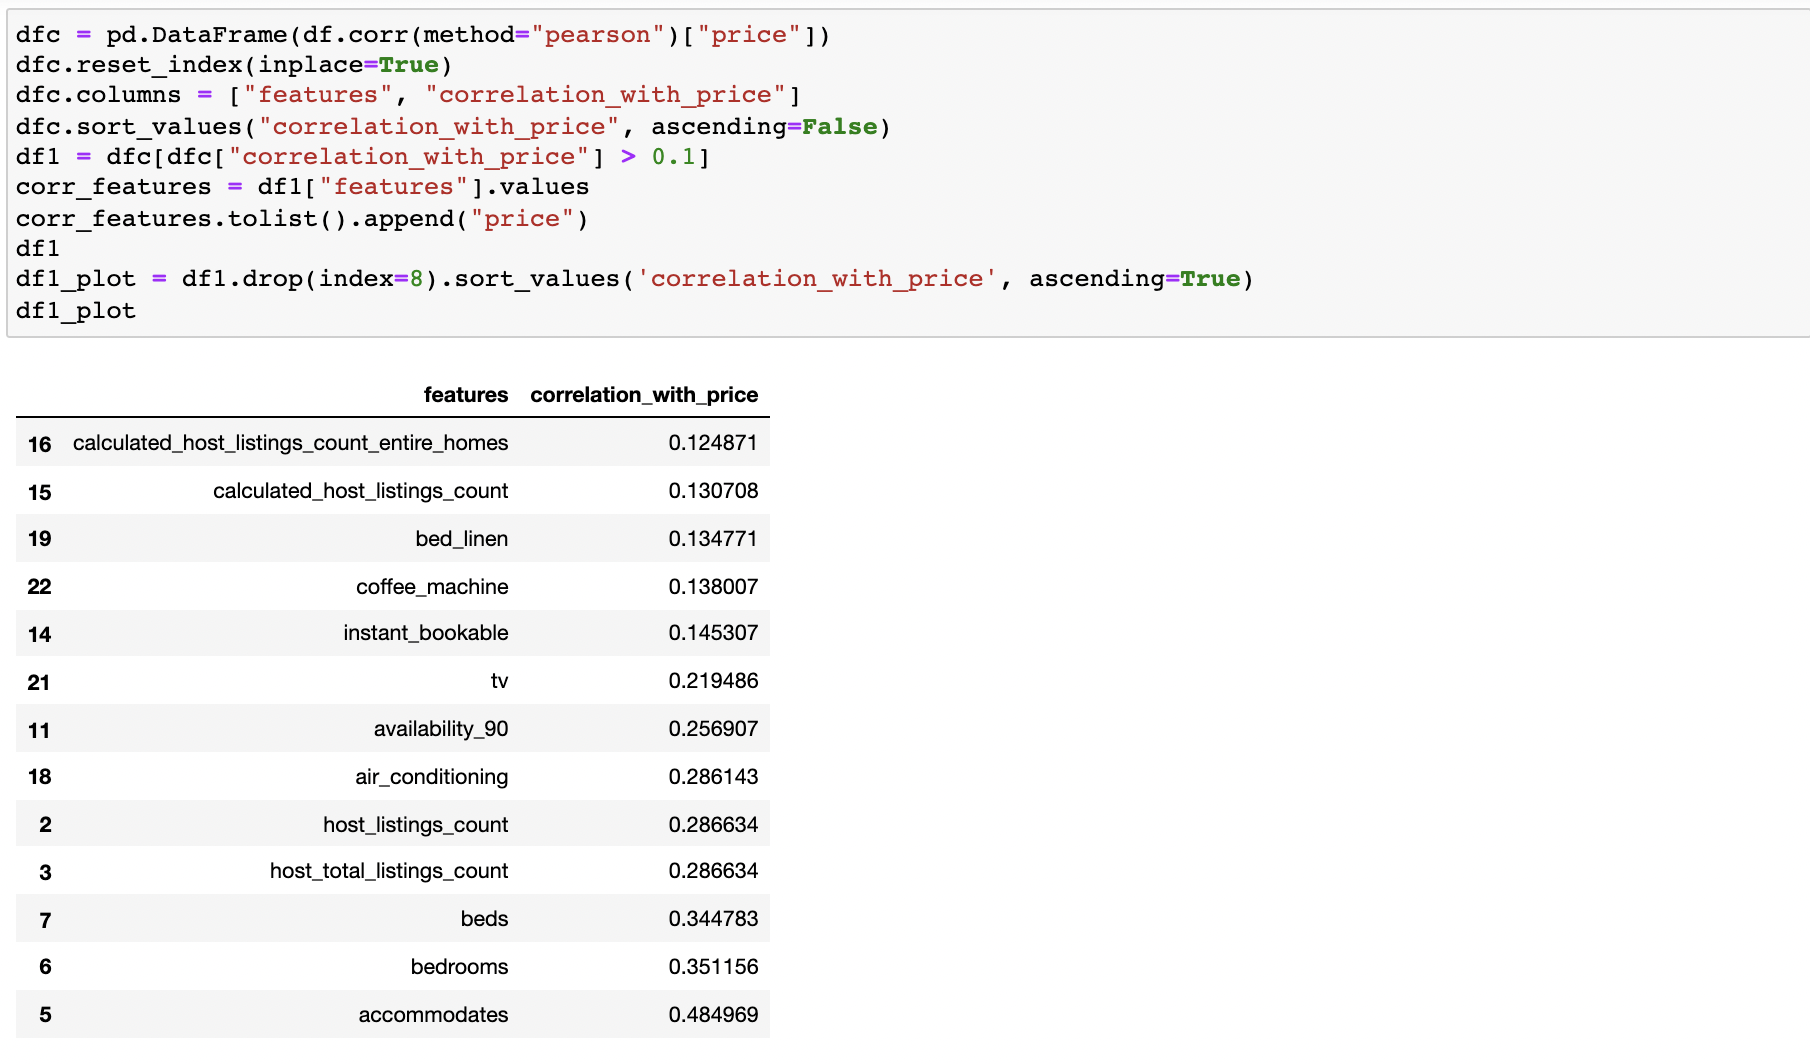
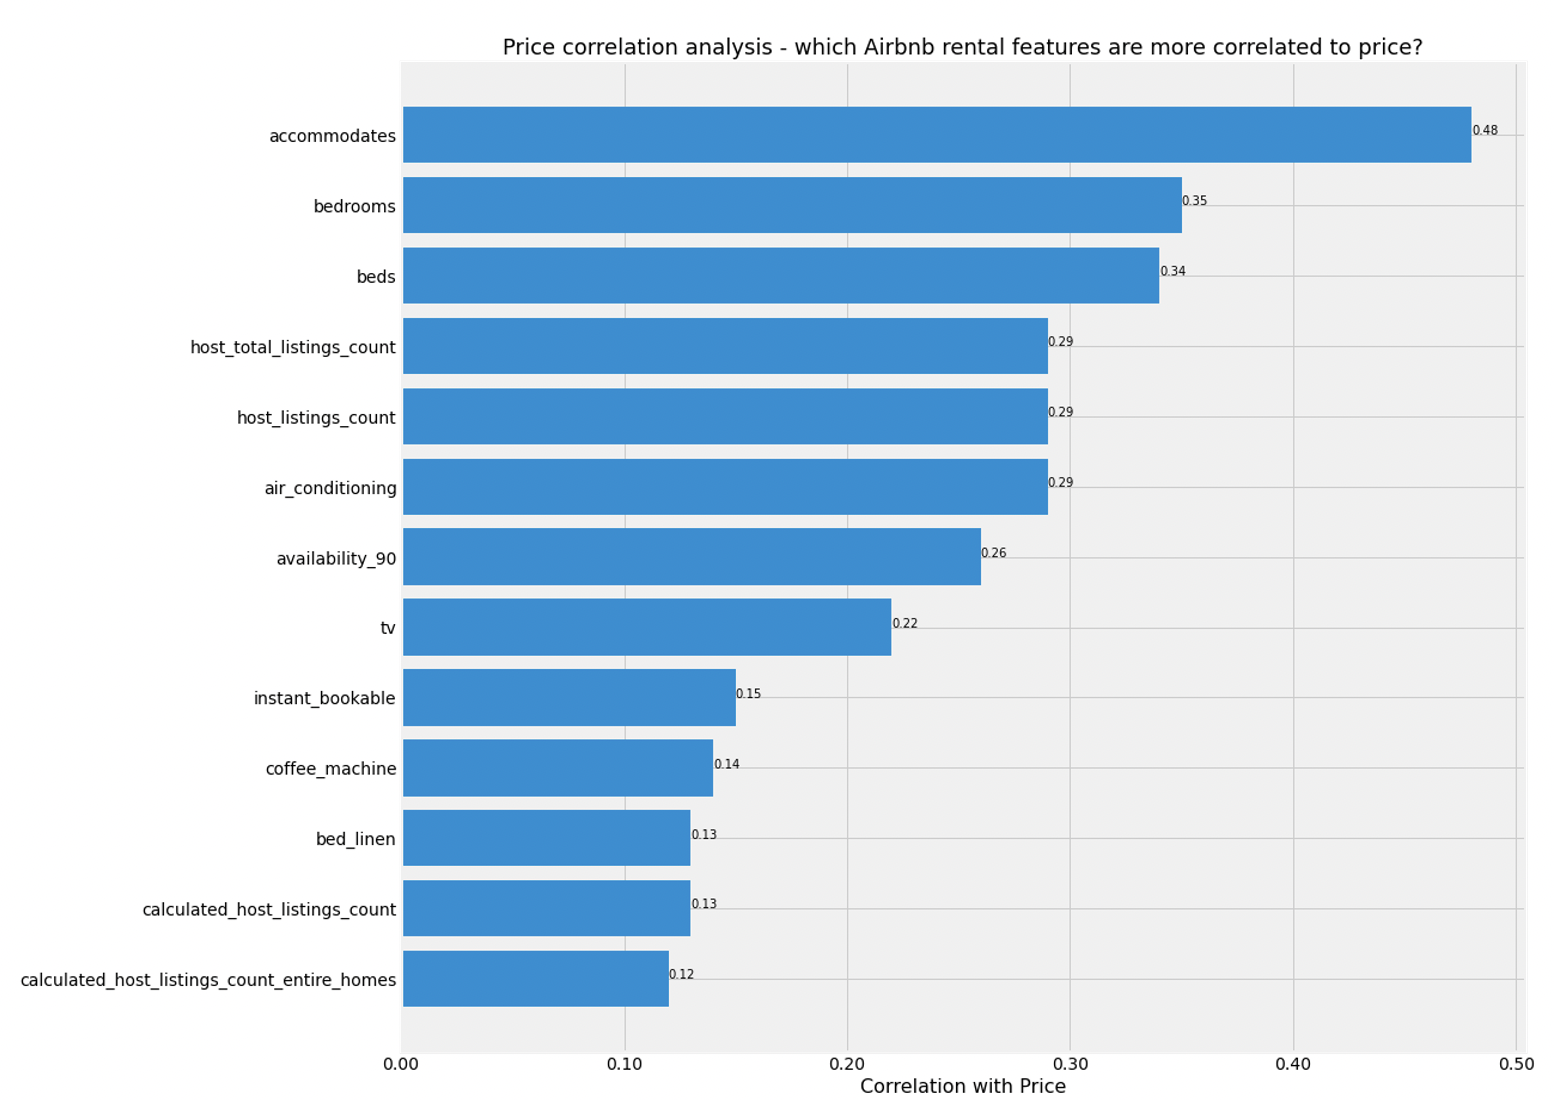
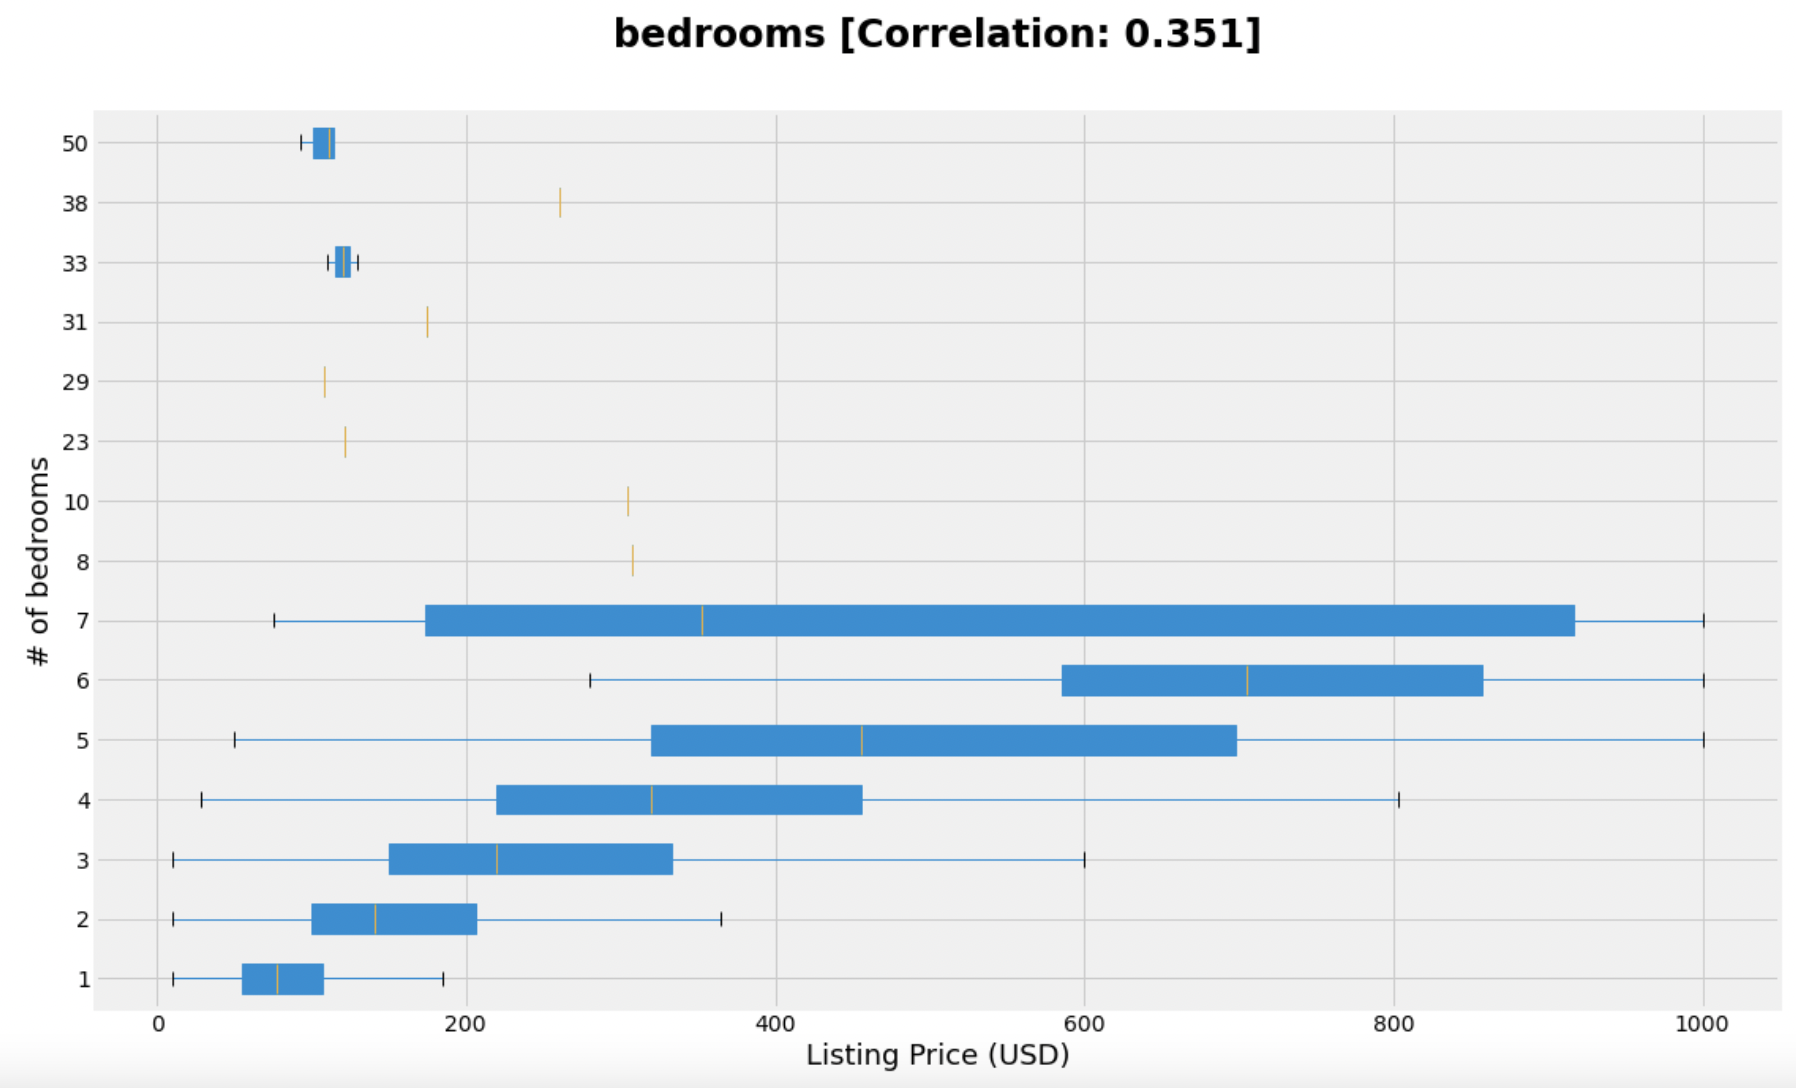
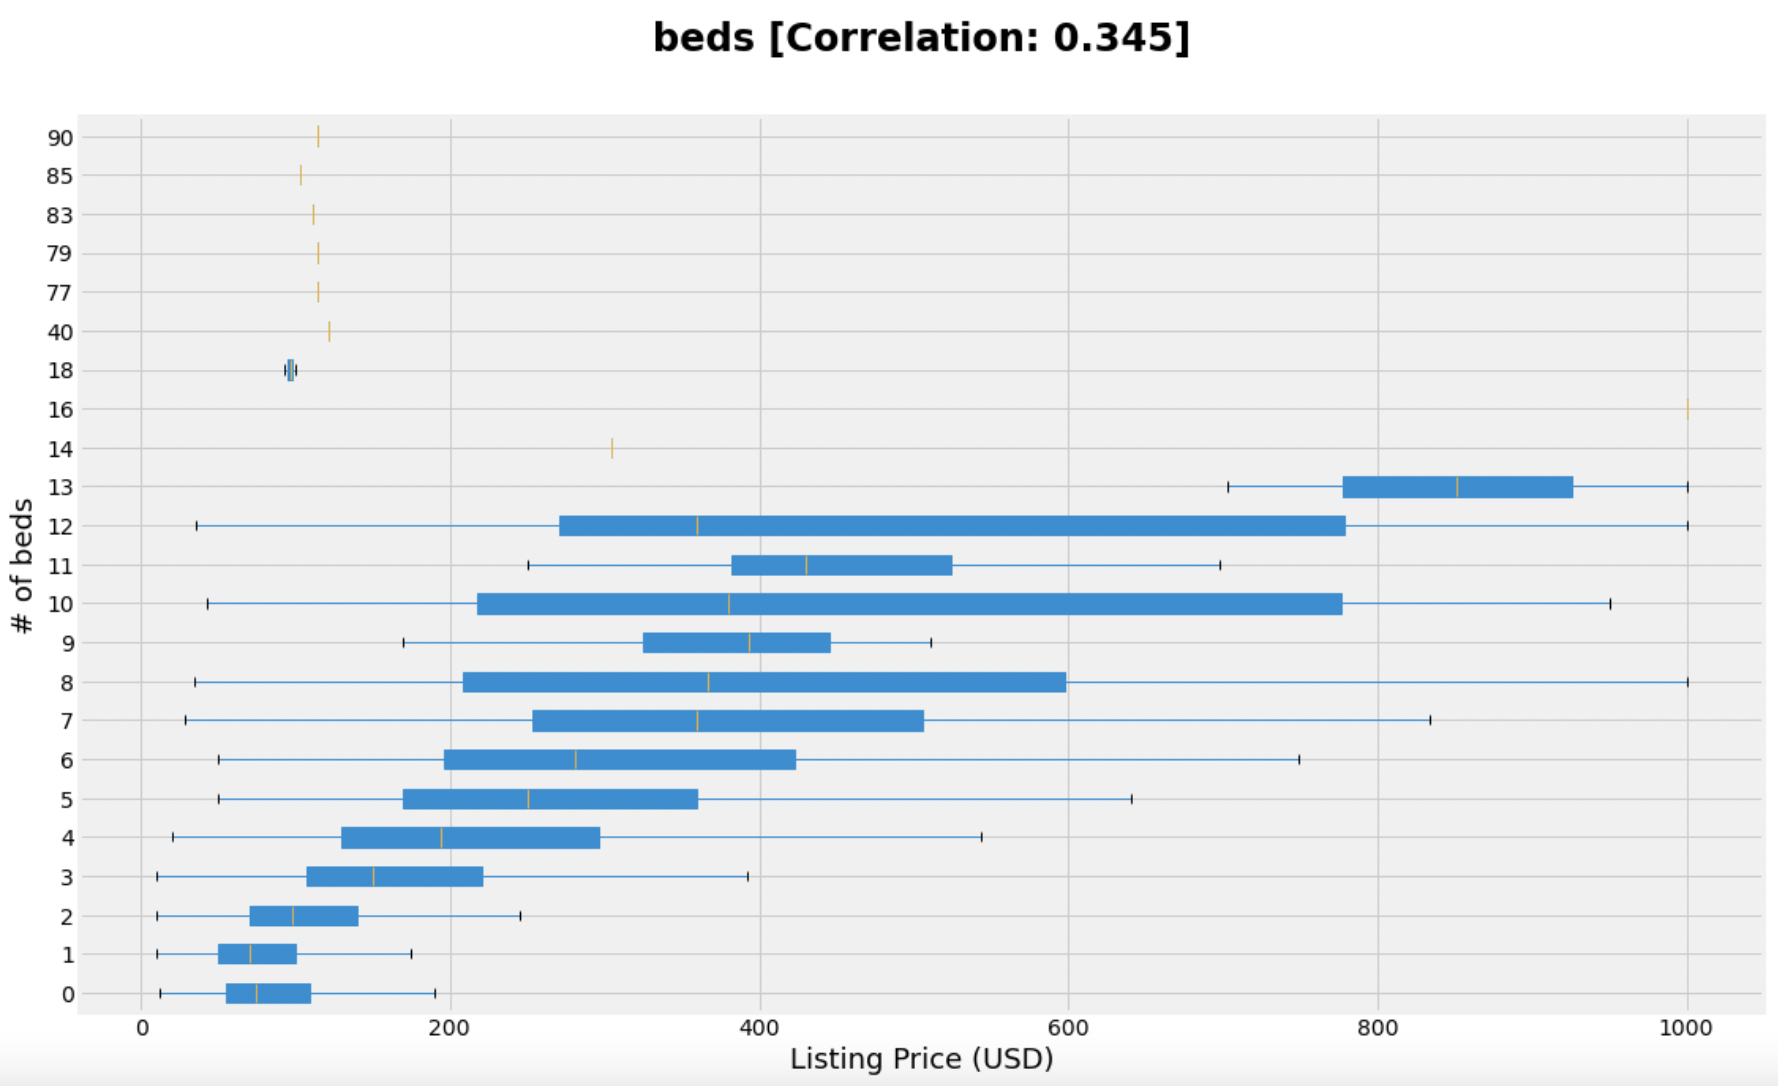
- Exploring categorical variables, and in particular using correlation analysis helped considerably in understanding the most important variables to use for regression analysis to predict nightly prices.
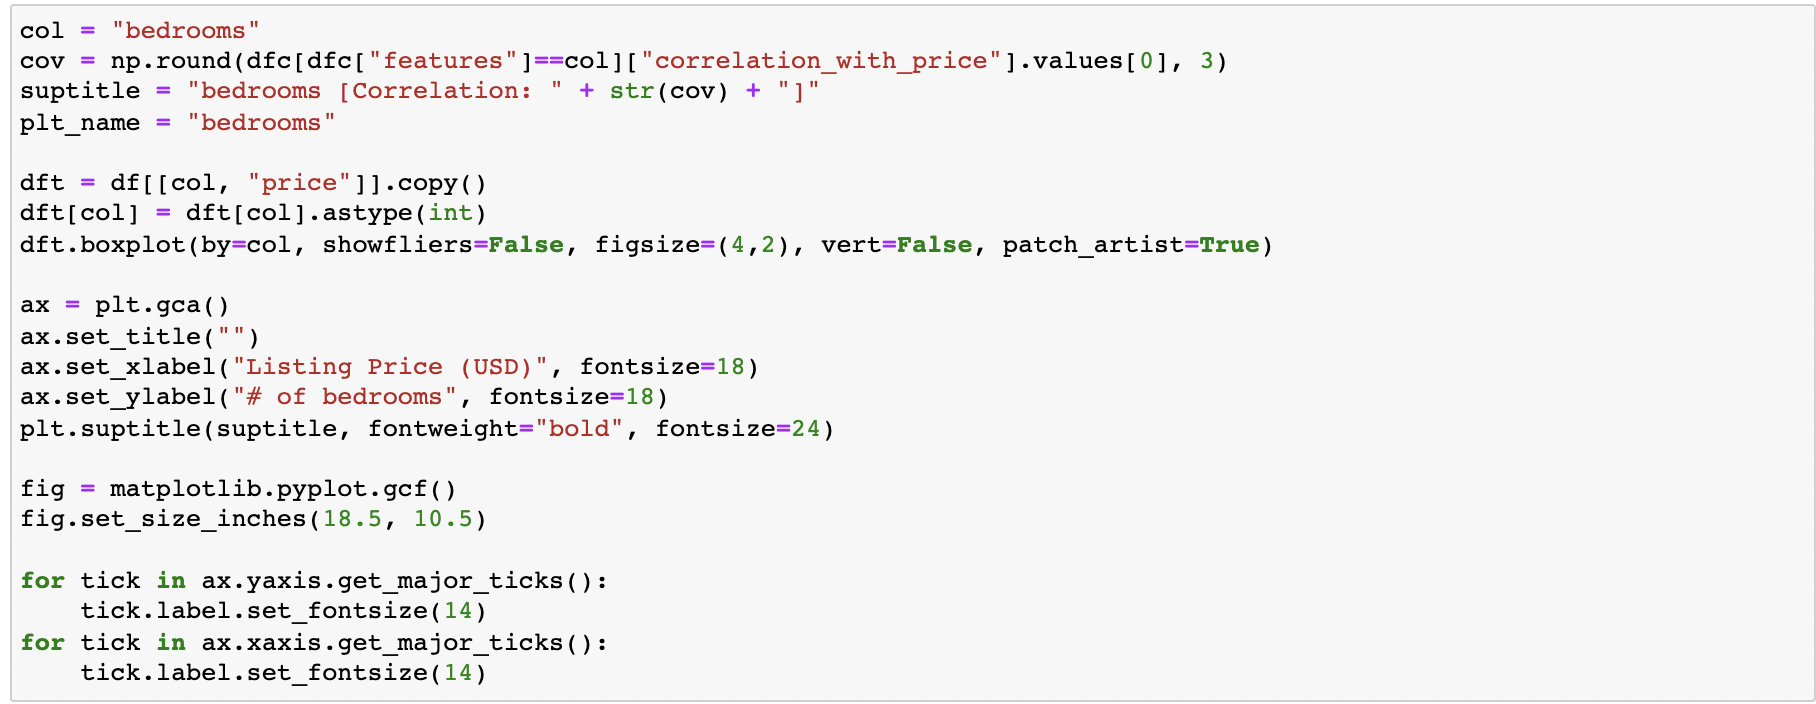
- Variables related to capacity (# of guests, # of bedrooms, # of beds) were the most positively correlated with price.
- Next in terms of explanatory power was host listings count. I don't believe this data is published to guests on the platform at time of booking, but the positve correlation to price does demonstrate that experience and knowledge of the platform is important and helps to reveal potential pricing power.
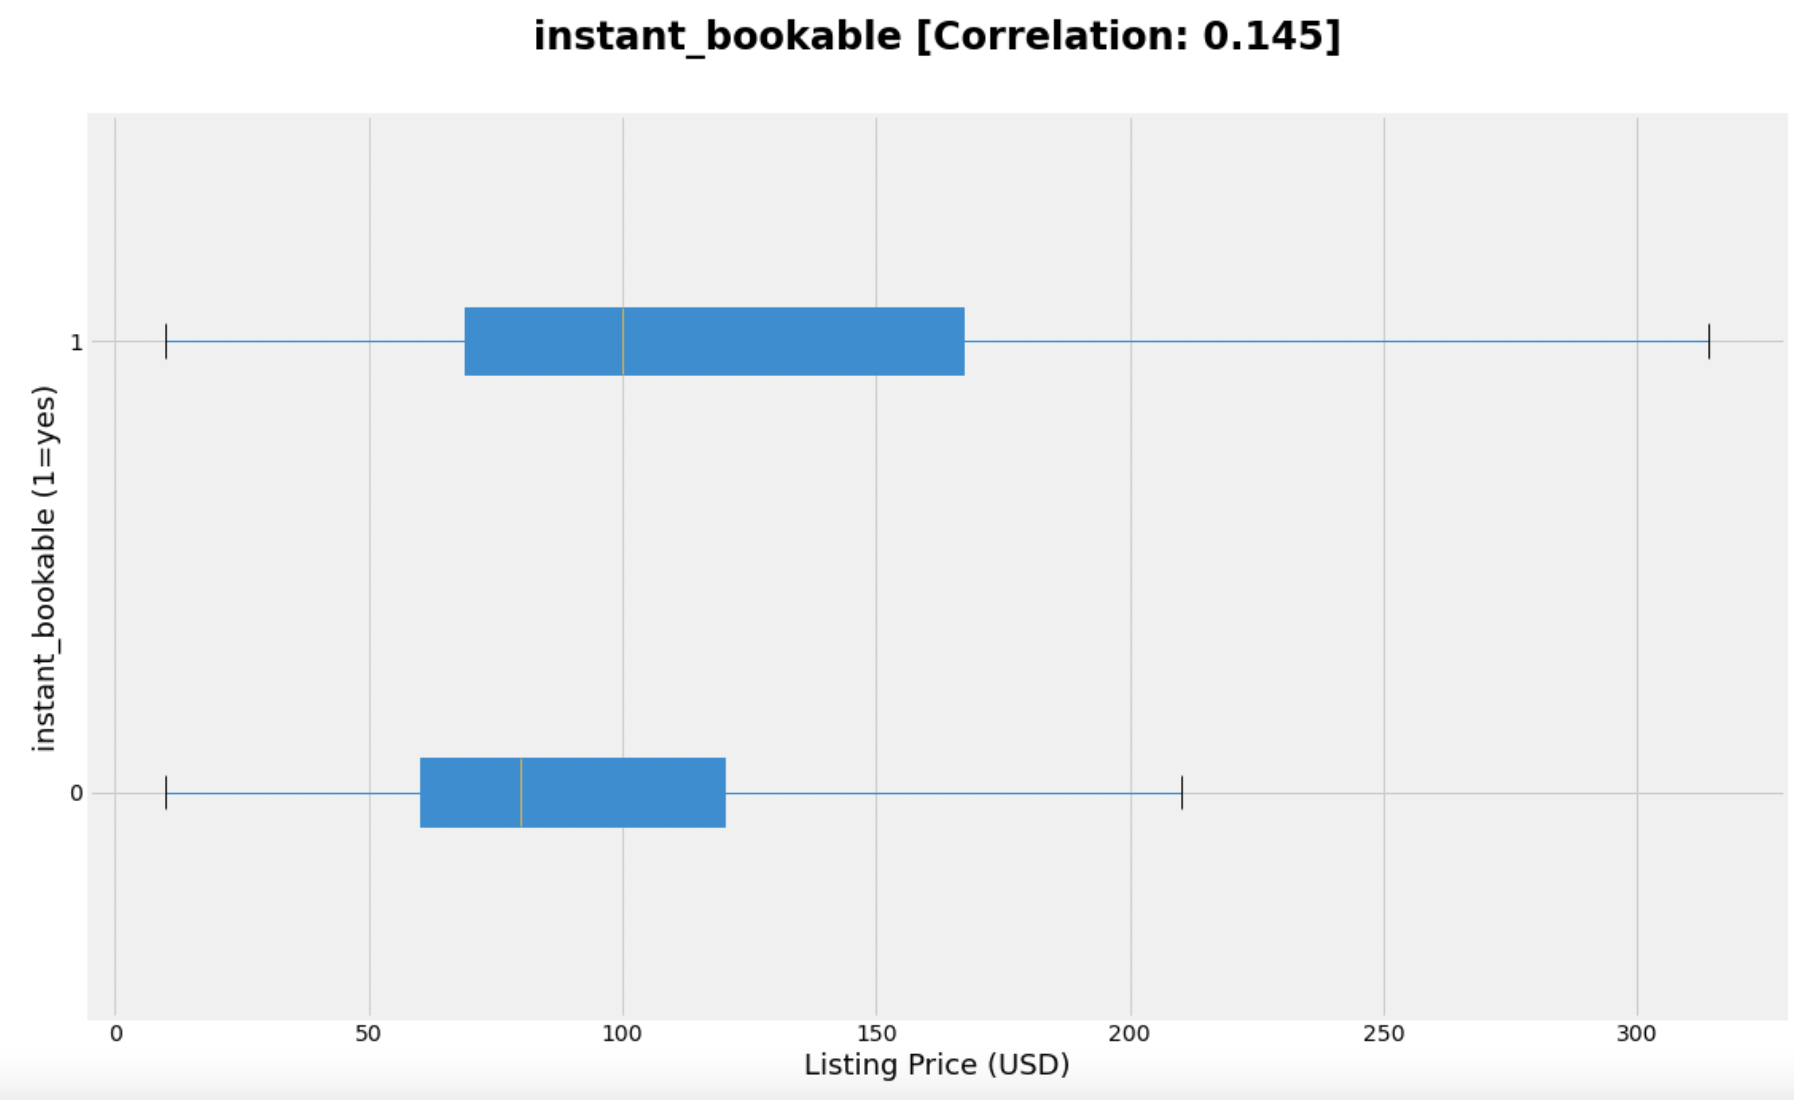
- Certain features (instant booking, 90-day availabiltiy) did remove some buyer friction and generally resulted in higher pricing
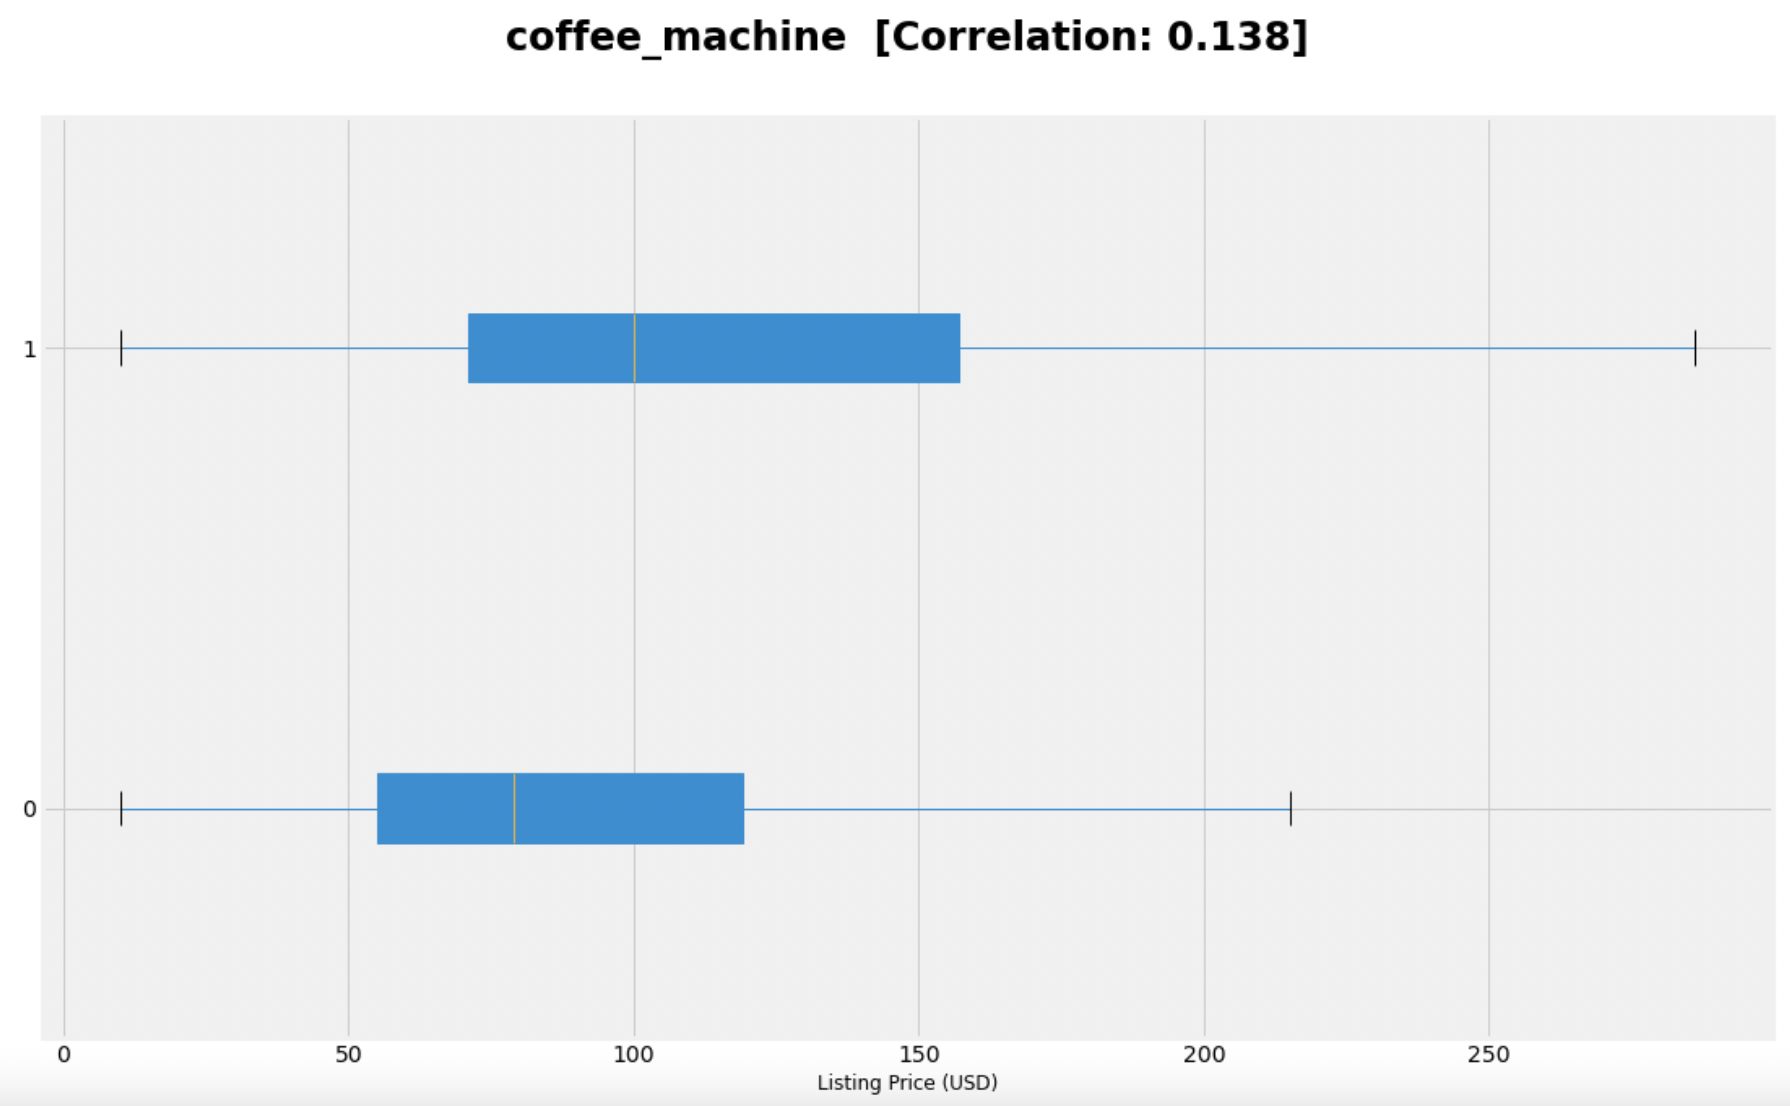
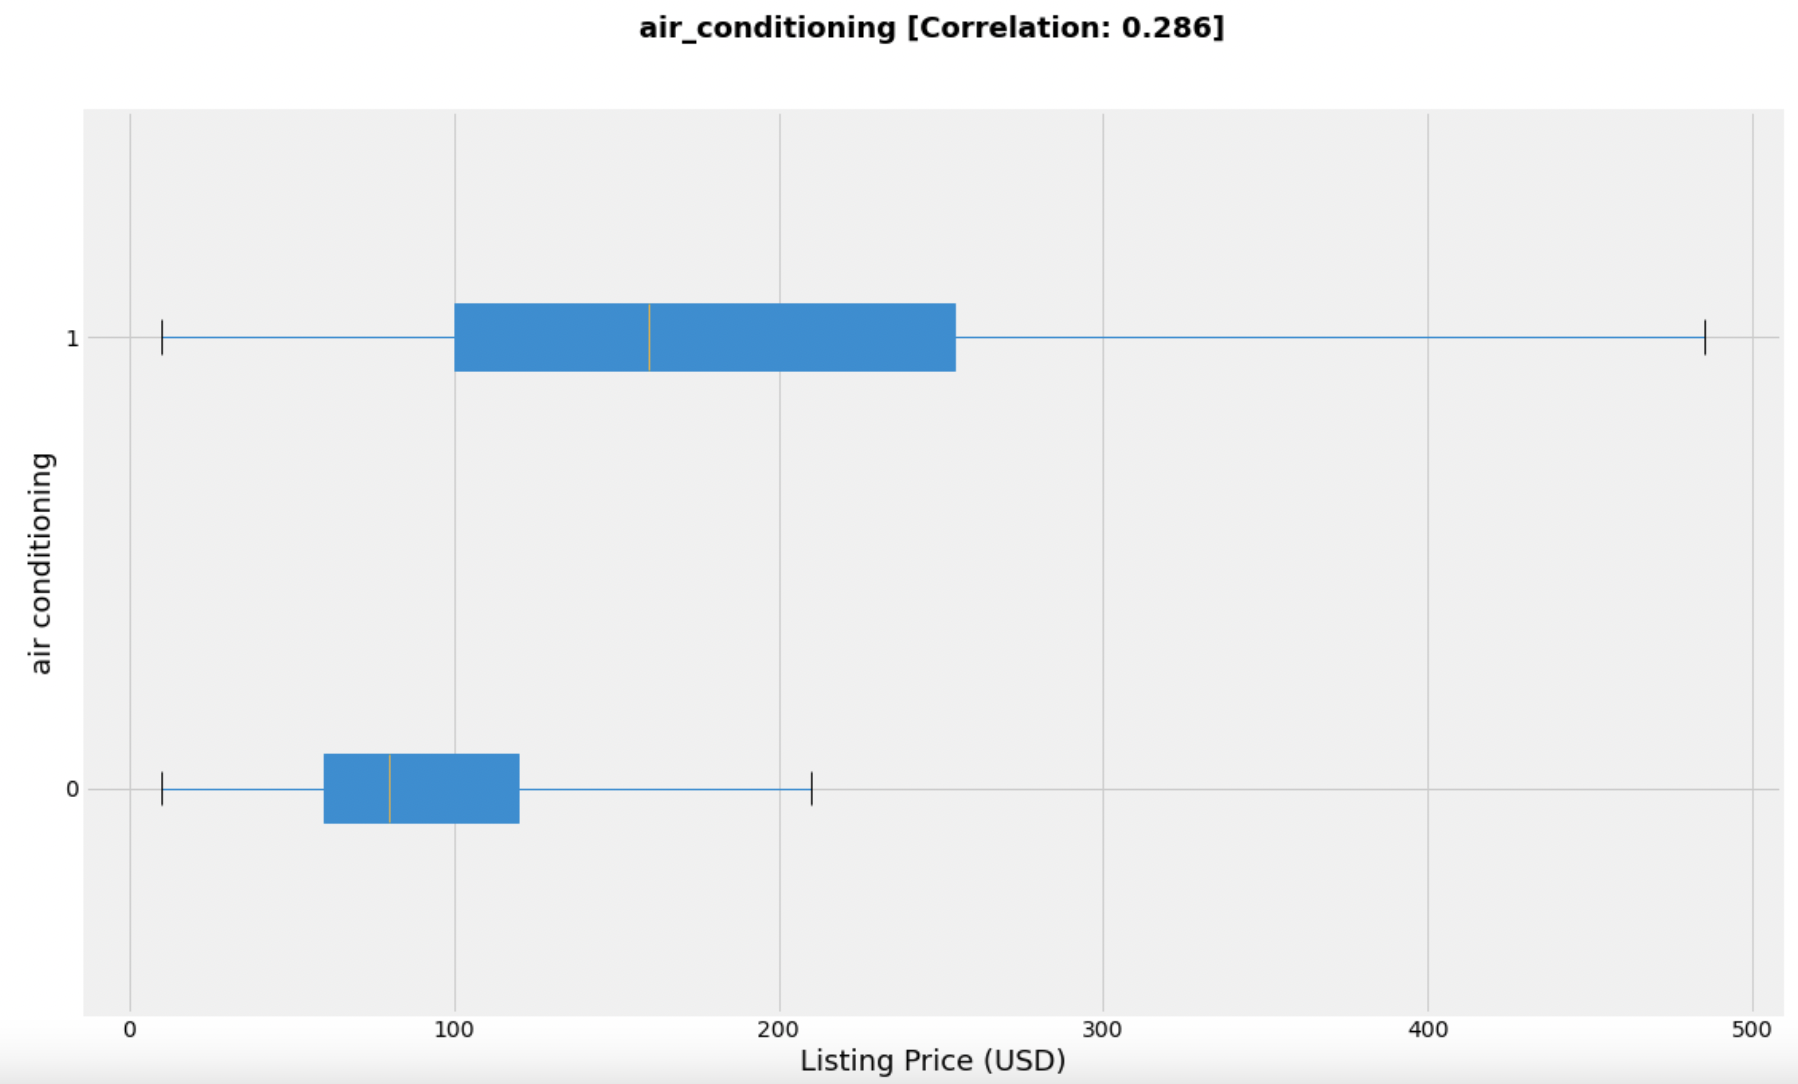
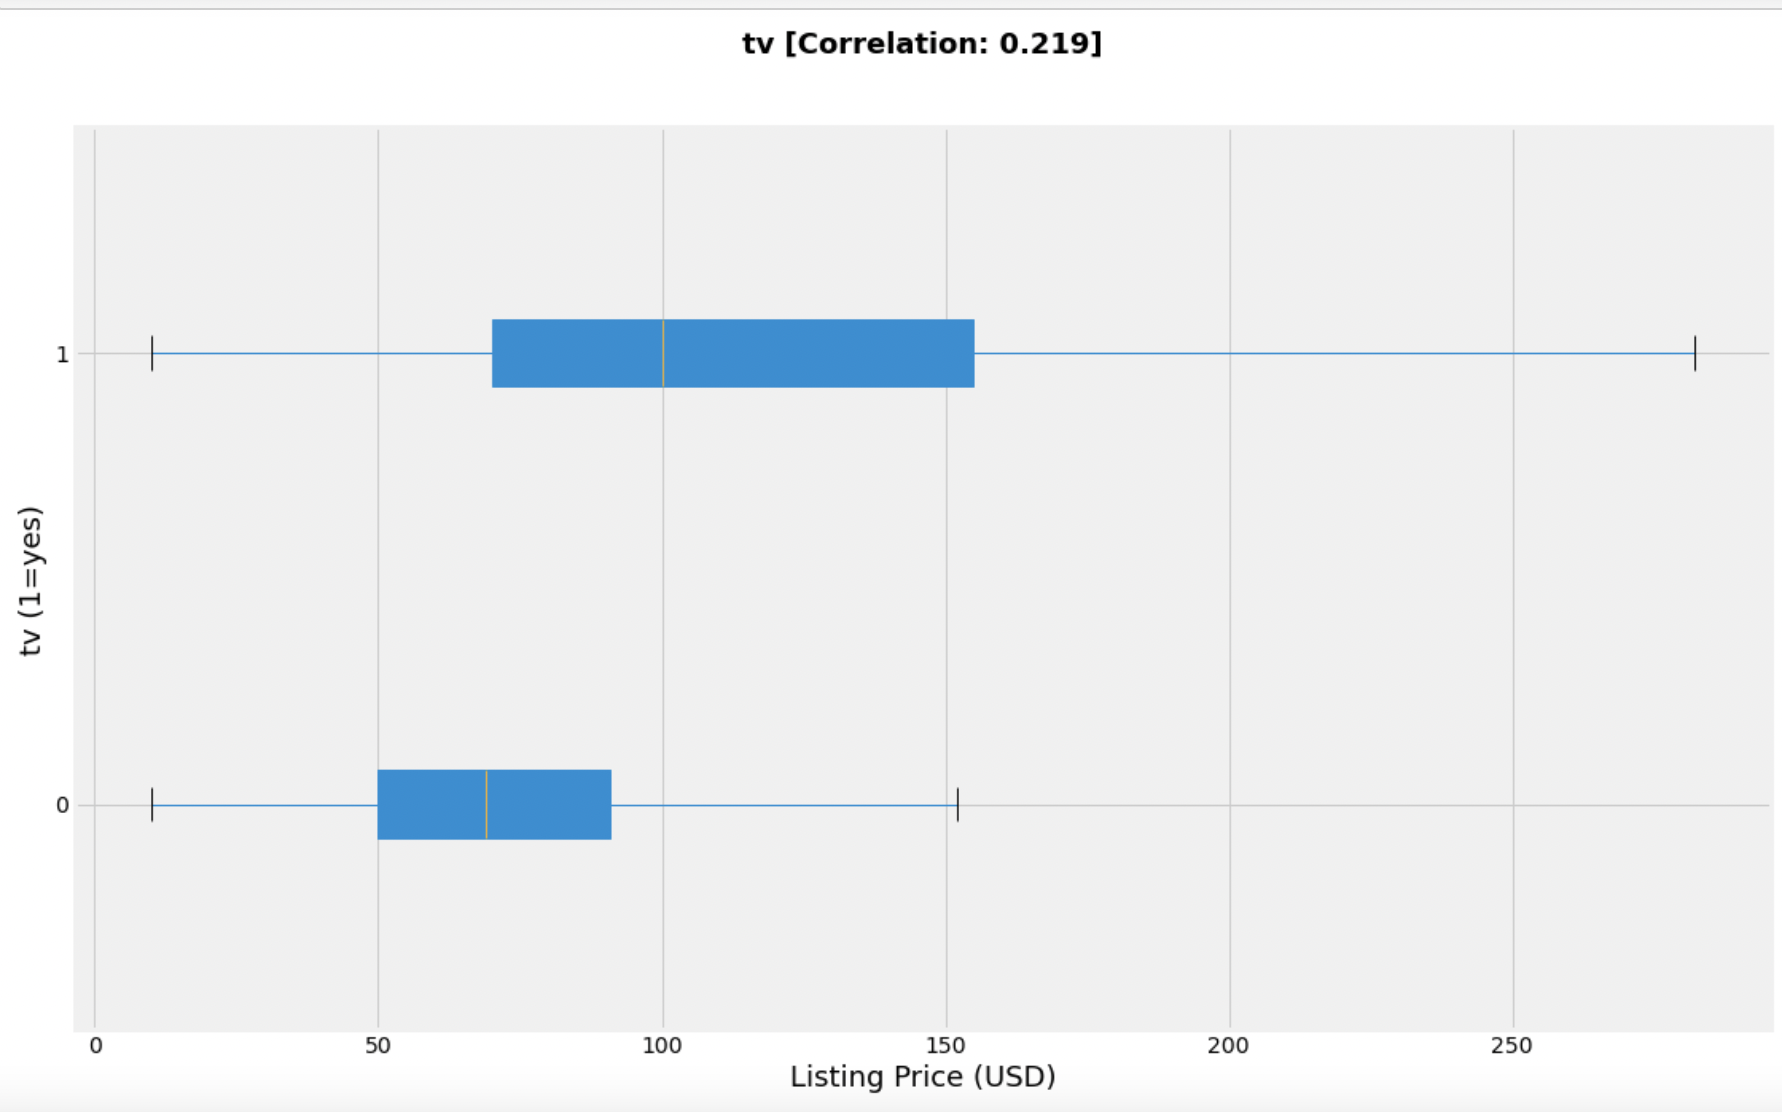
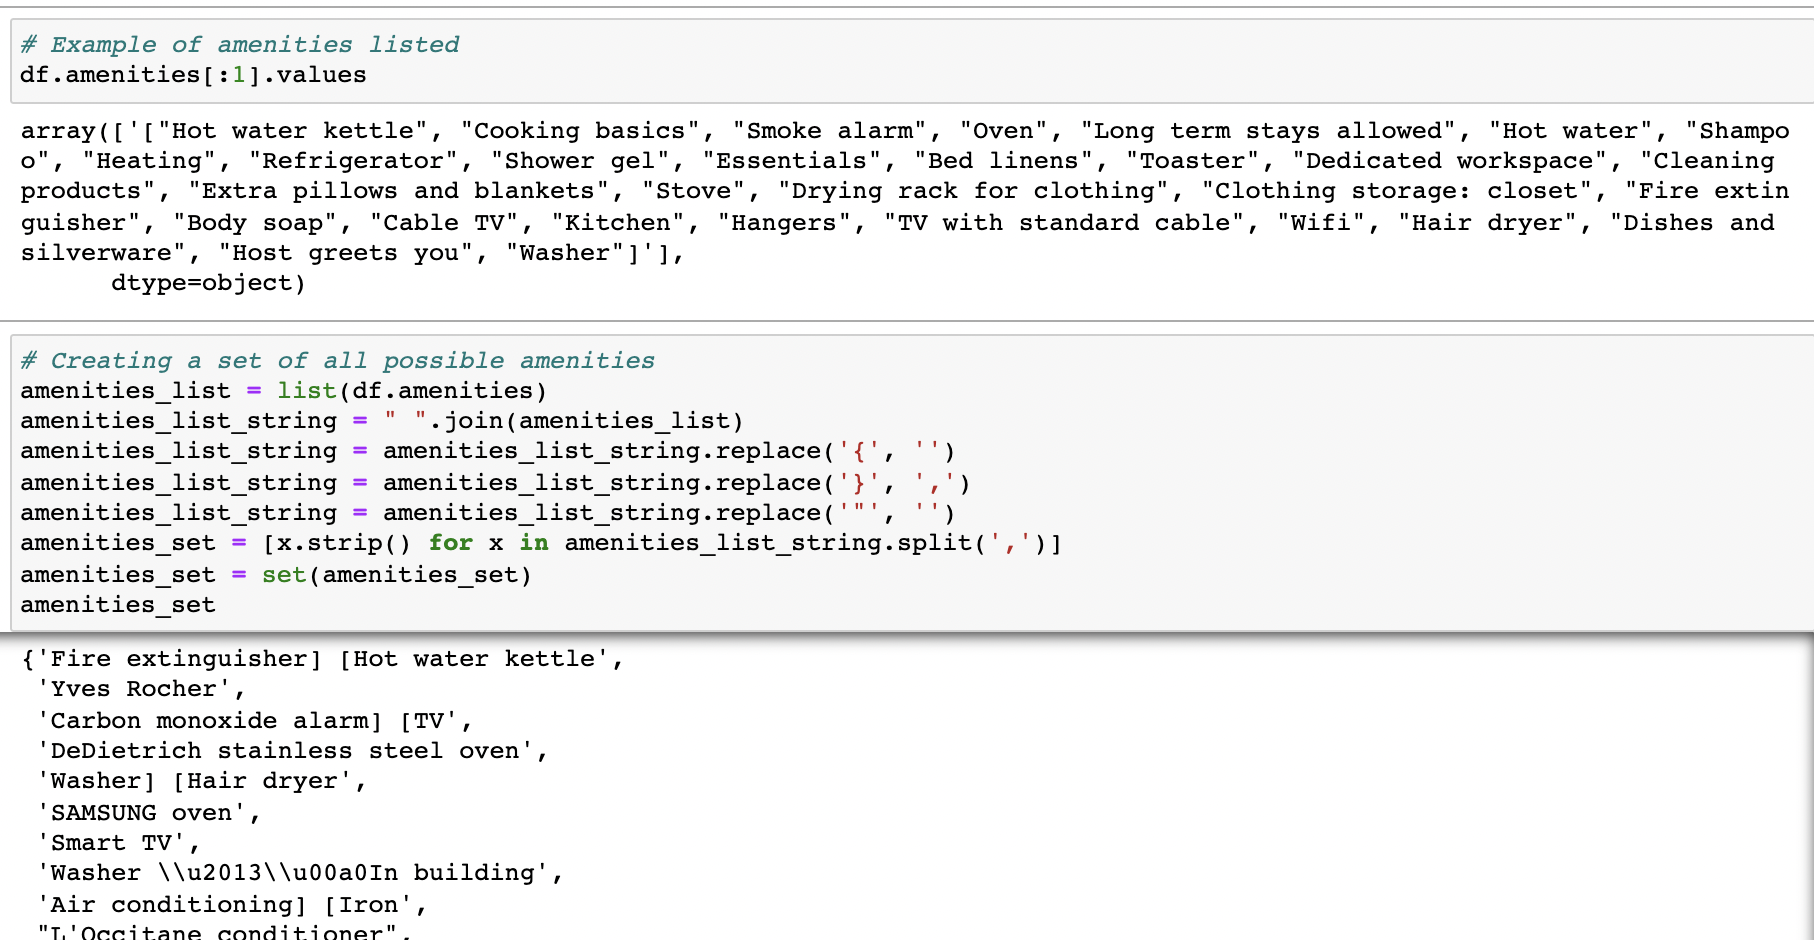
- The presence of certain amenities (air conditioning, tv, coffee machine, etc) are positively correlated with pricing, but to a lesser extent than capacity, host experience and booking features.


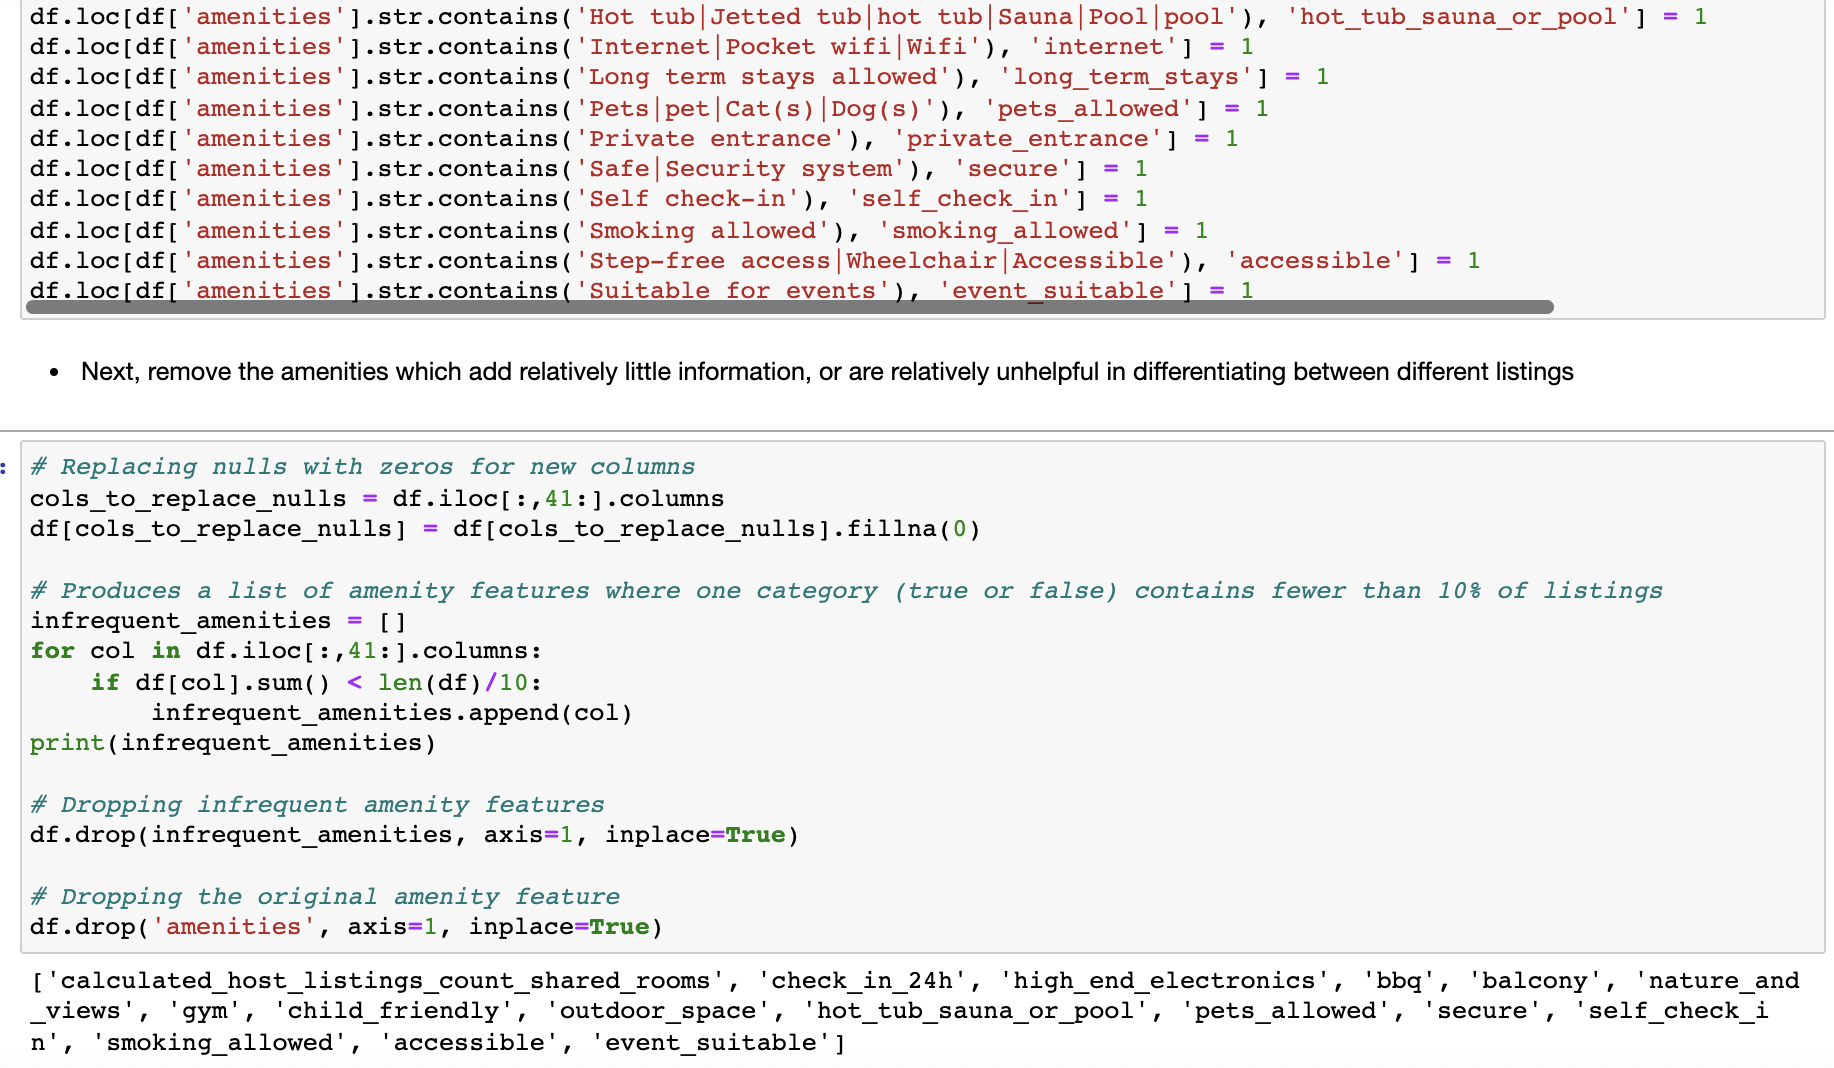
Boolean features
Appendix 1: Cleaning and pre-processing - raw data (n=50,133)
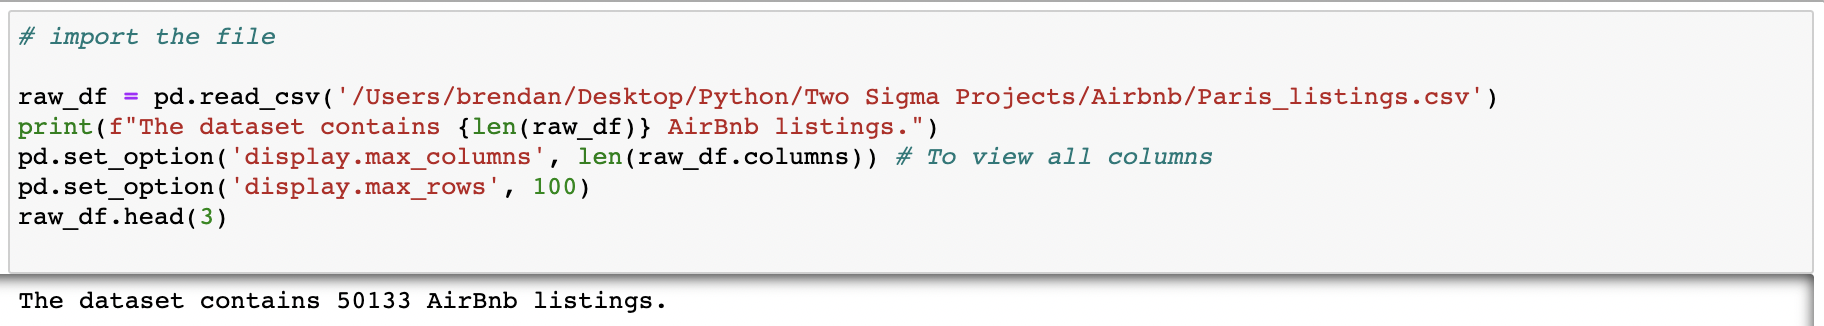
The dataset does have some limitations and is quite extensive; to facilitate analysis I started by importing necessary python packages and libraries, then explored and ultimately cleaned the data.
Importing the libraries and data
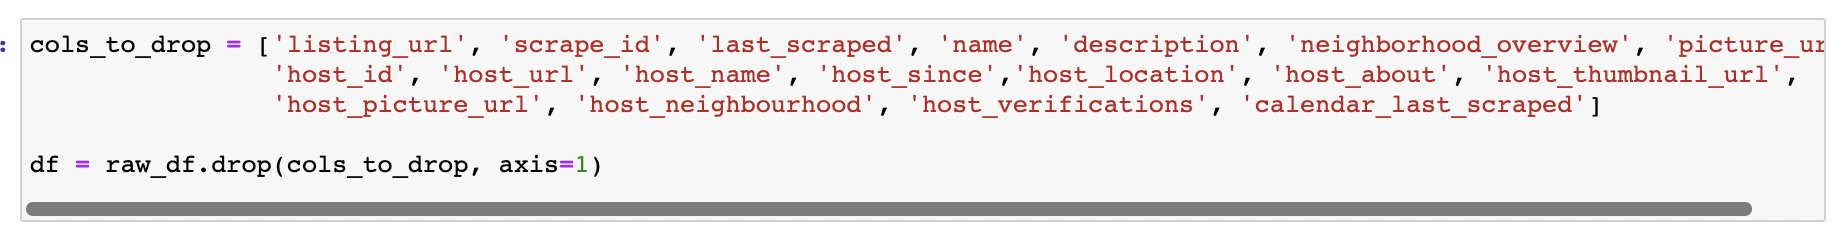
Dropping initial columns
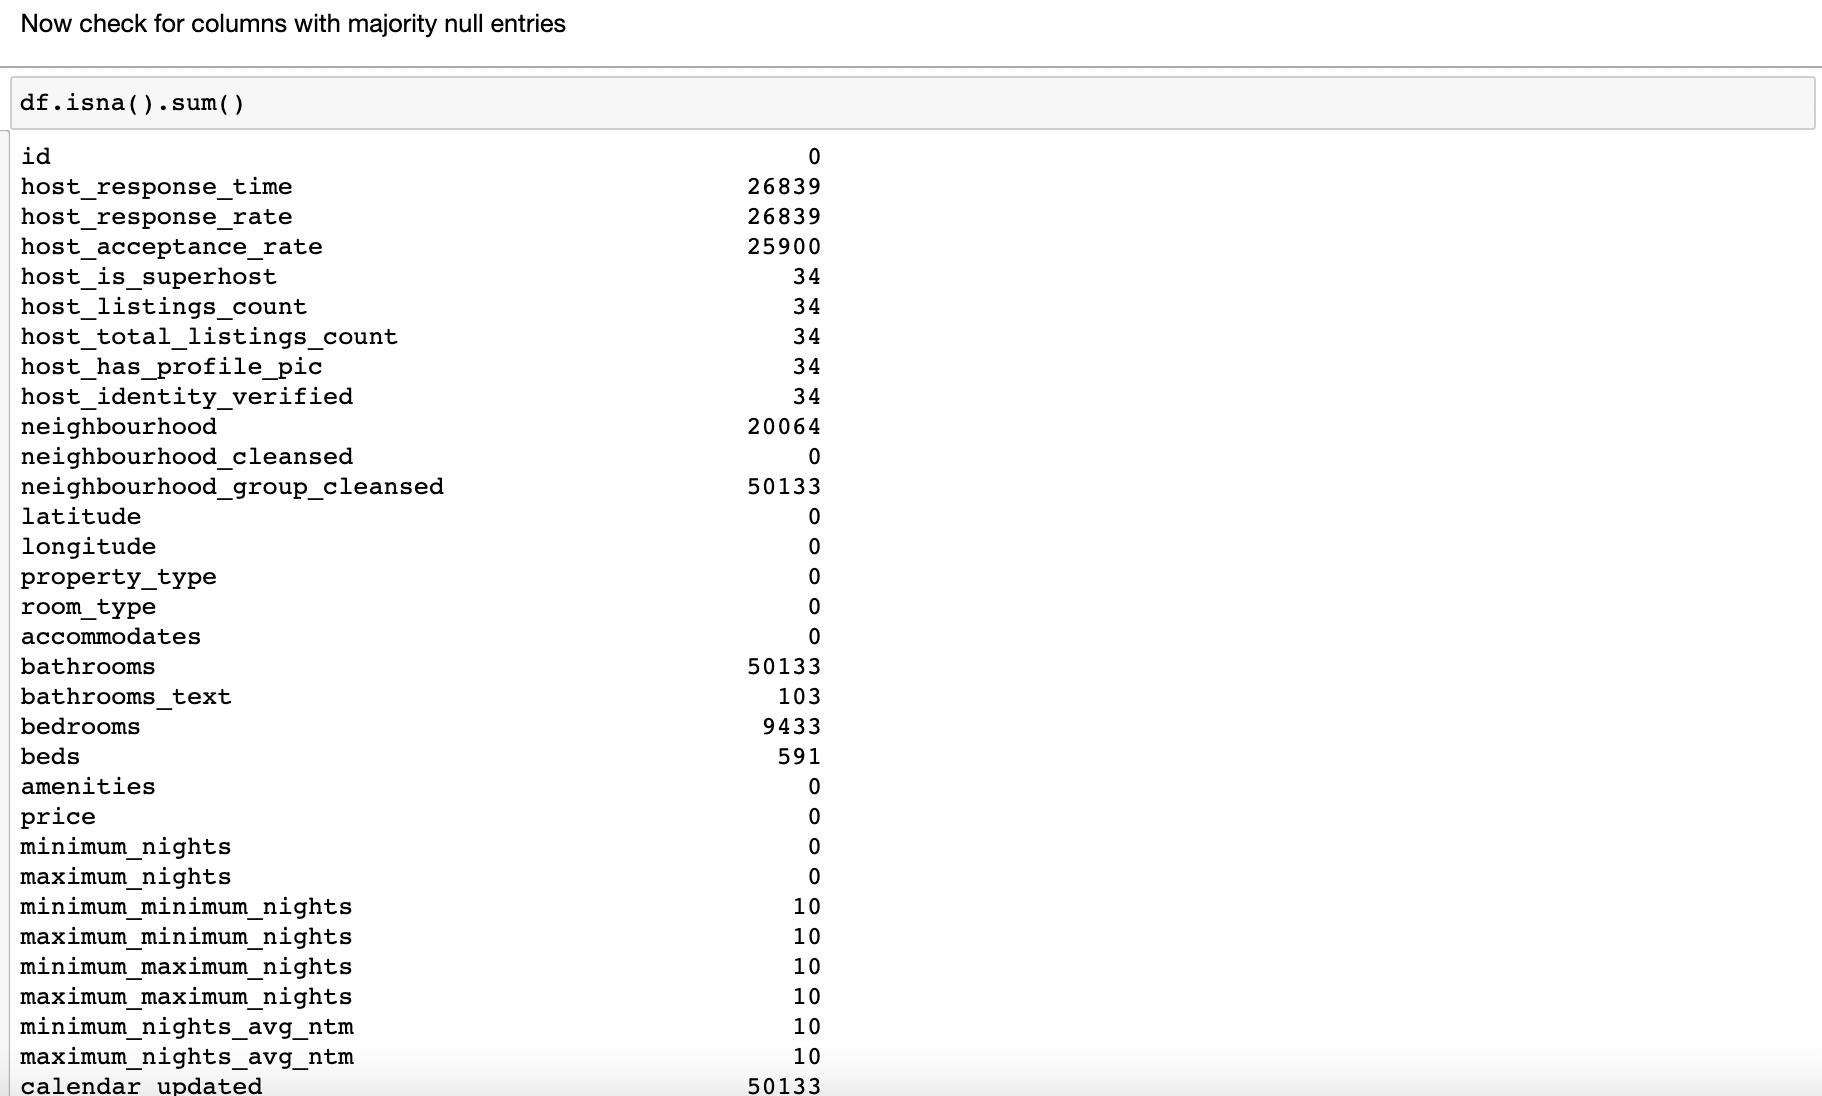
To simplify the dataset, I dropped certain columns that did not prove helpful in predicting price. I also checked for missing data - and dropped those columns that had a majority of data that is null.
Now I checked for the boolean and categorical data, to see if any of them are worth including:
From the above, it can be seen that several columns only contain one category and can be dropped.
Description of each column:
- host_since - date that the host first joined Airbnb
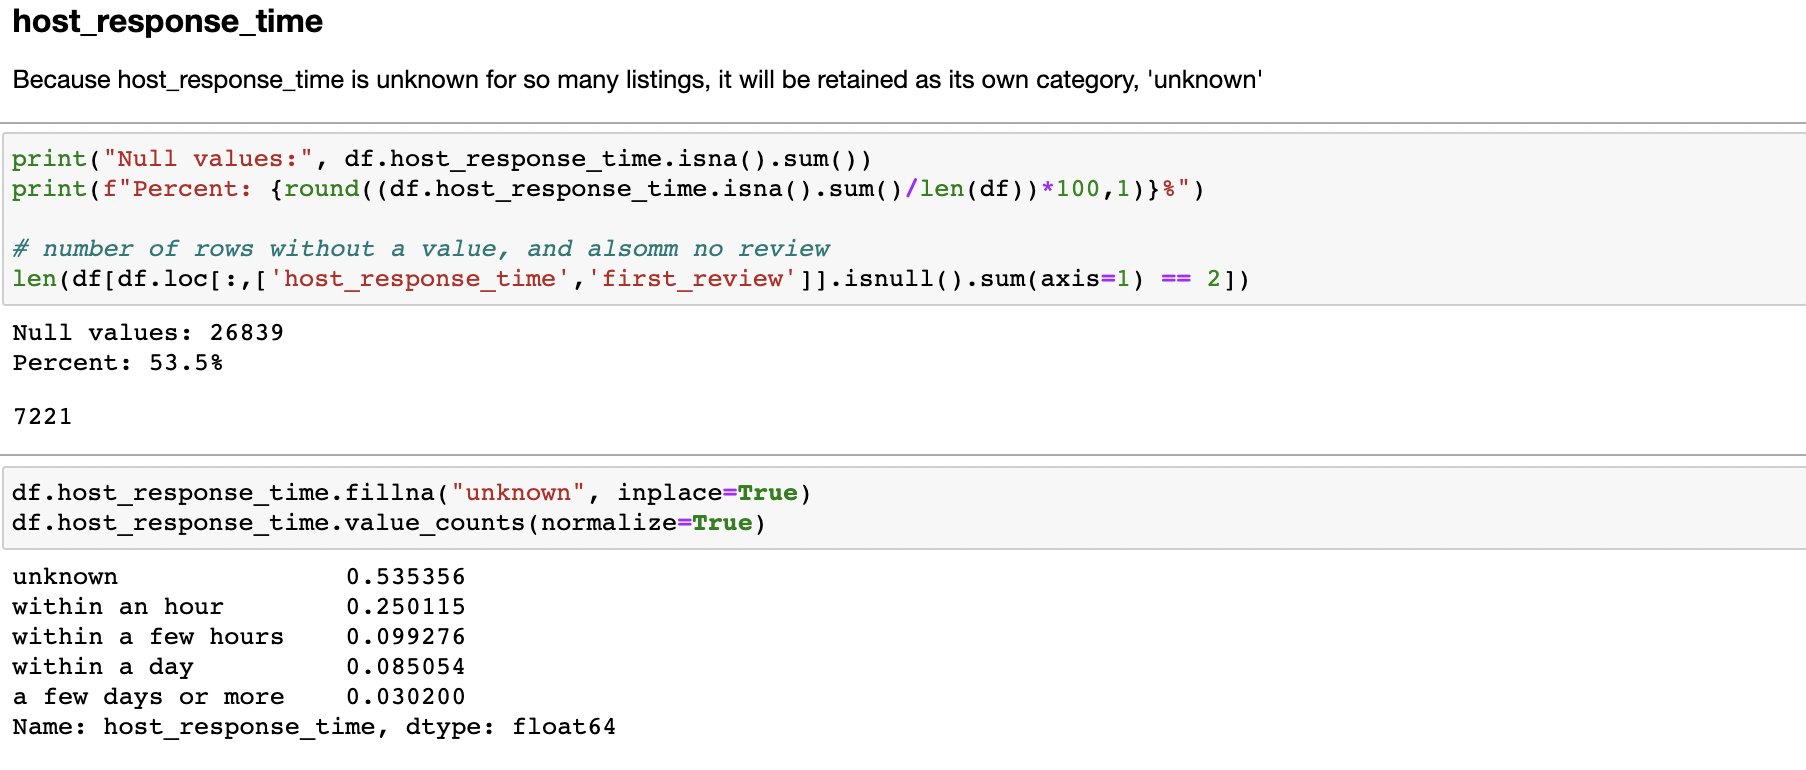
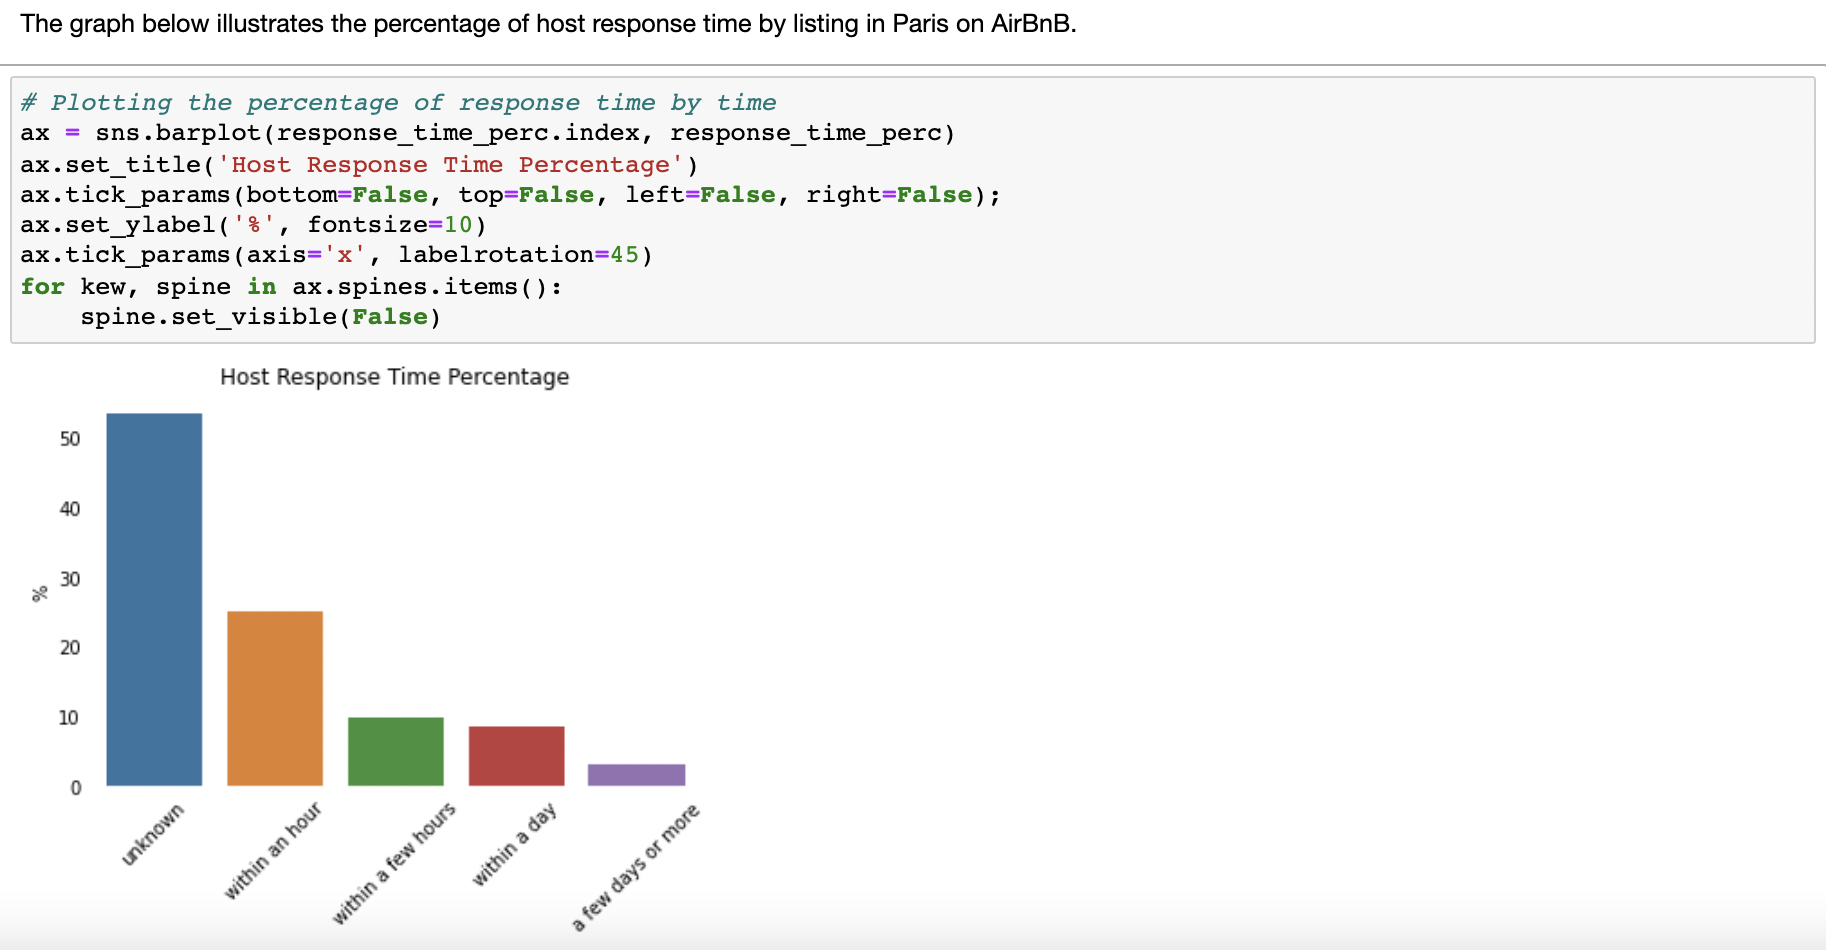
- host_response_time - average amount of time the host takes to communicate
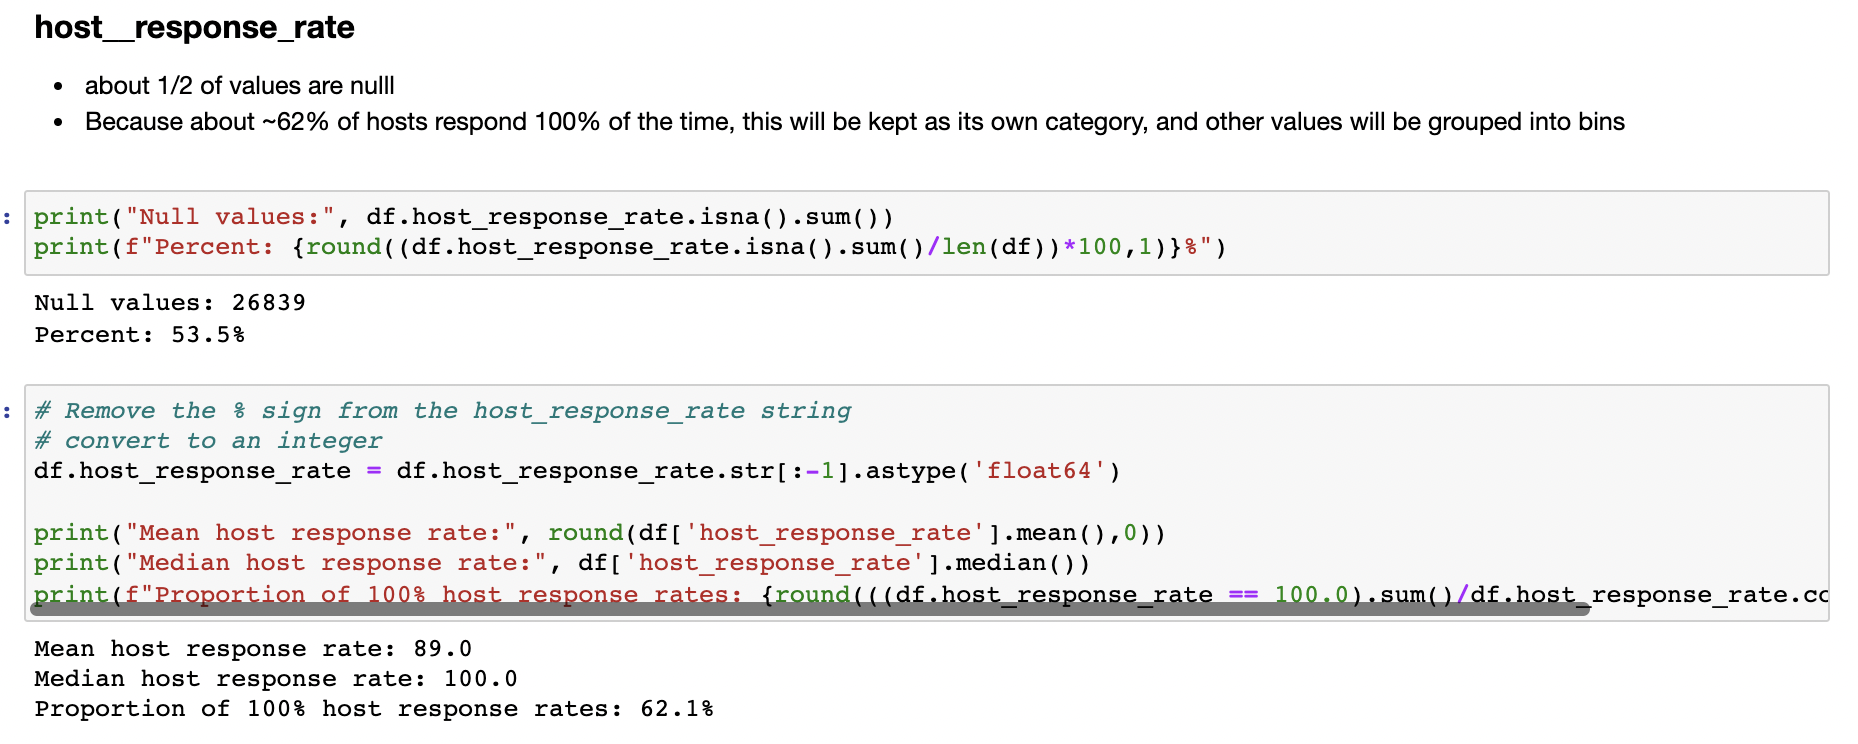
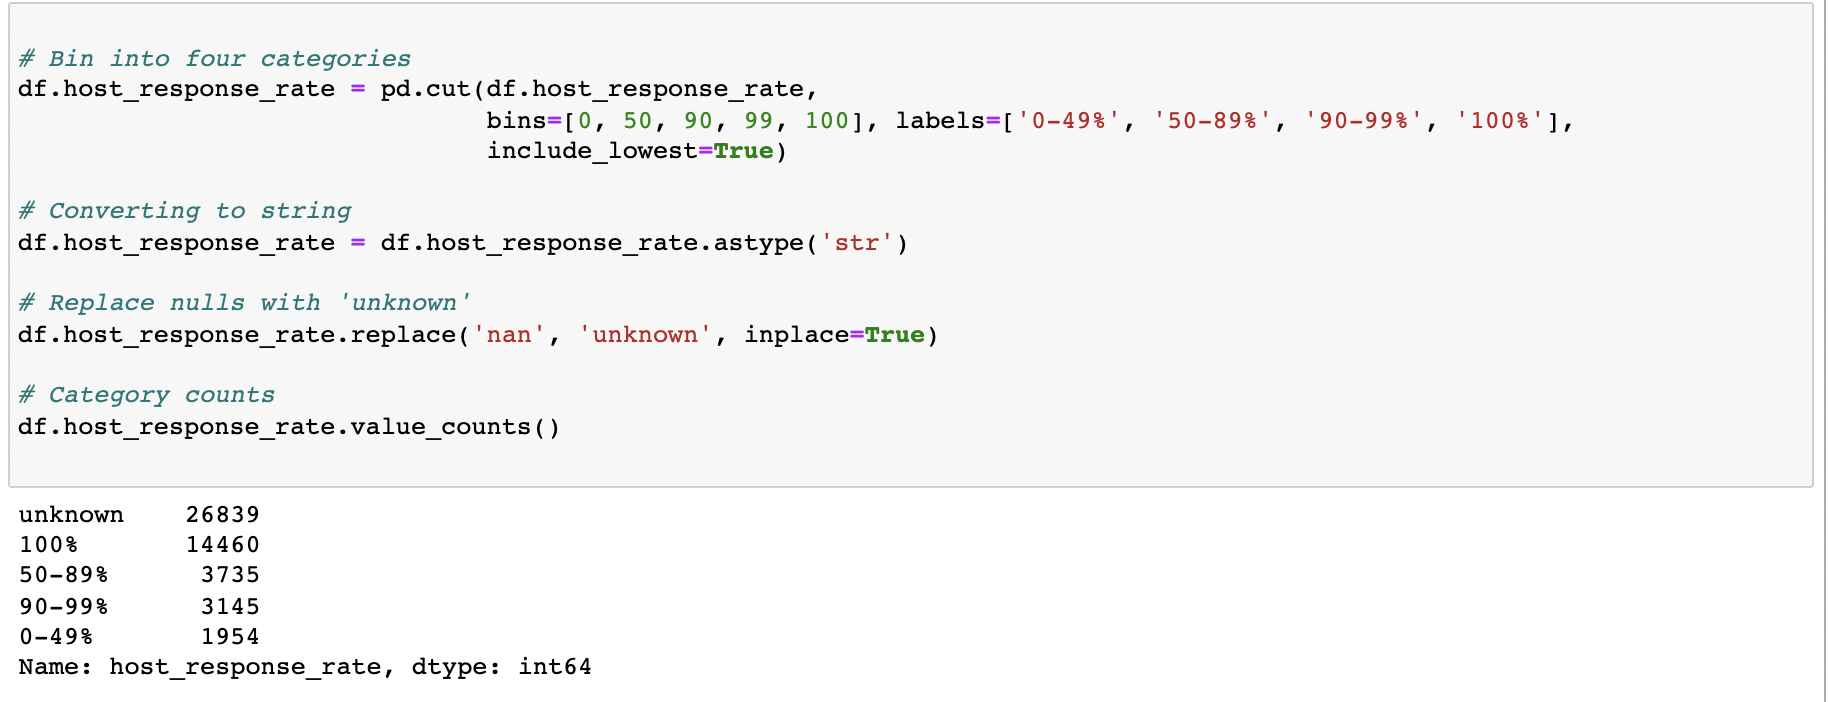
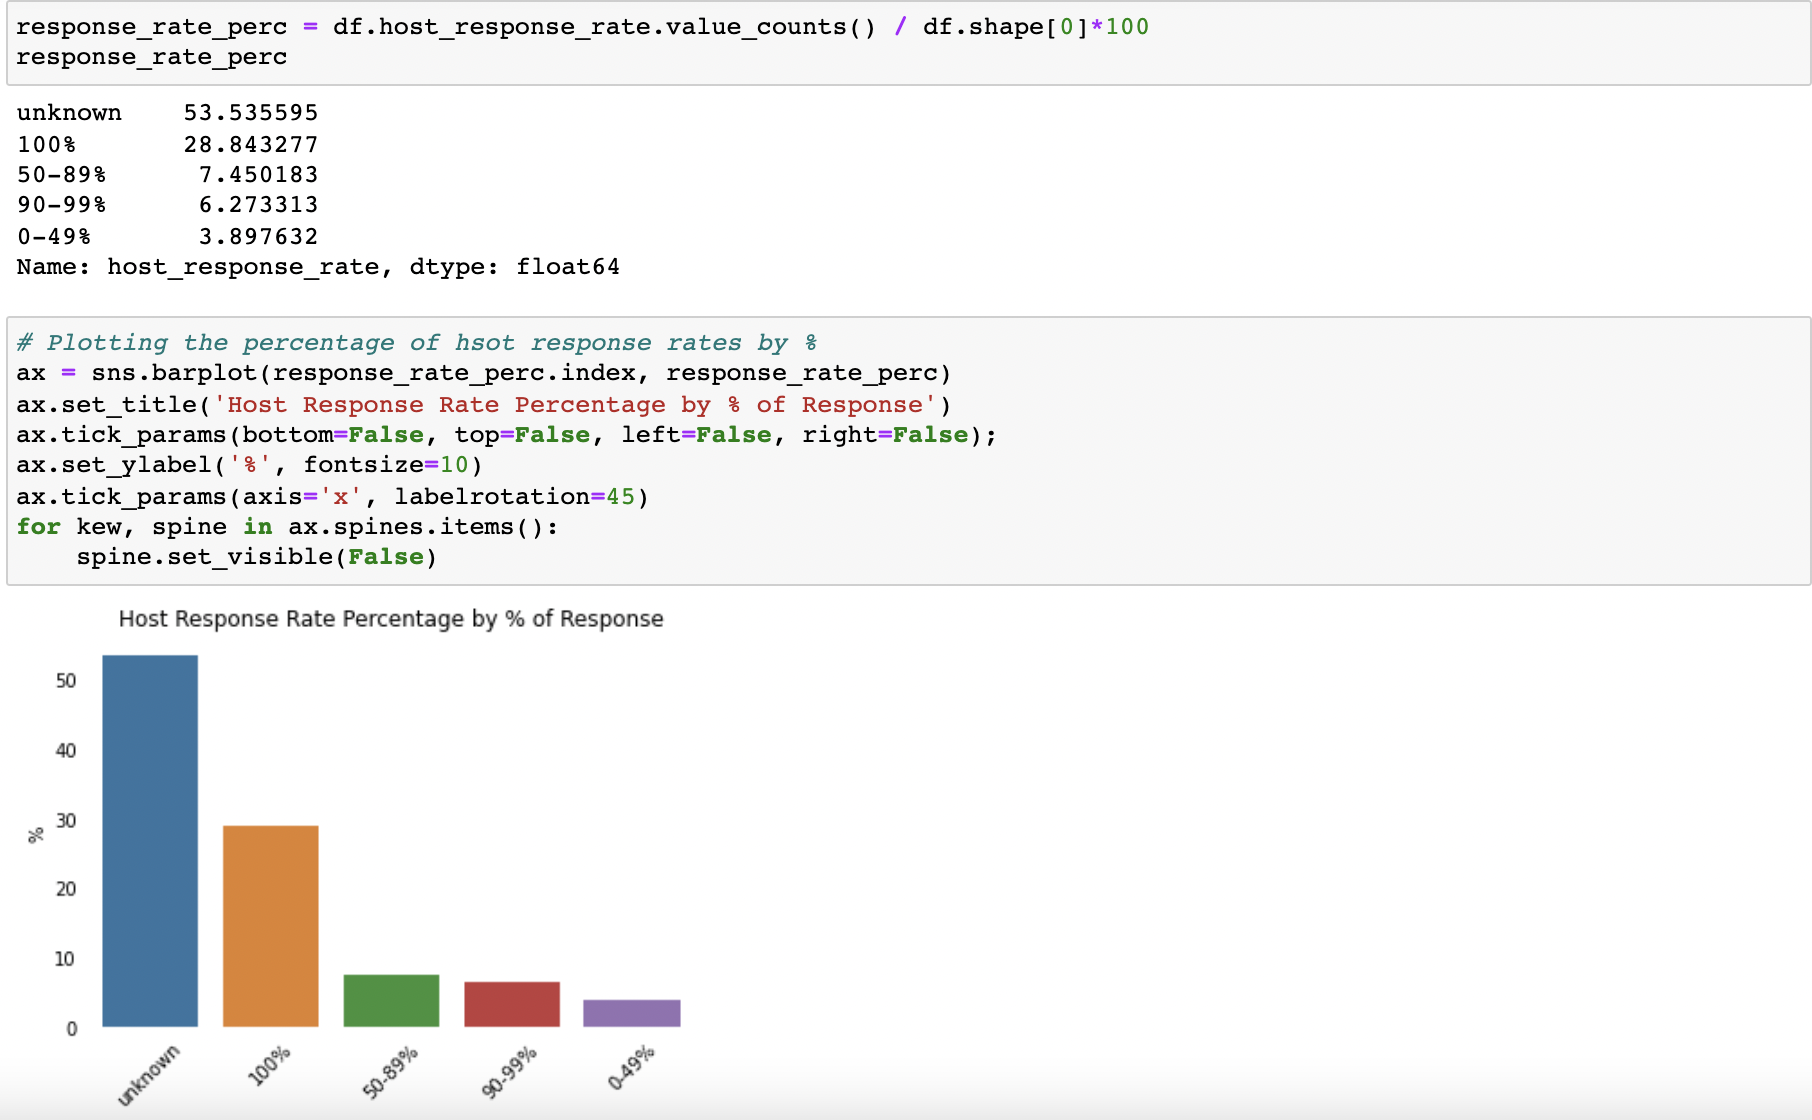
- host_response_rate - proportion of messages that the host replies to
- host_is_superhost - whether or not the host is a superhost, which is a mark of quality for the top-rated and most experienced hosts, and can increase search ranking on Airbnb
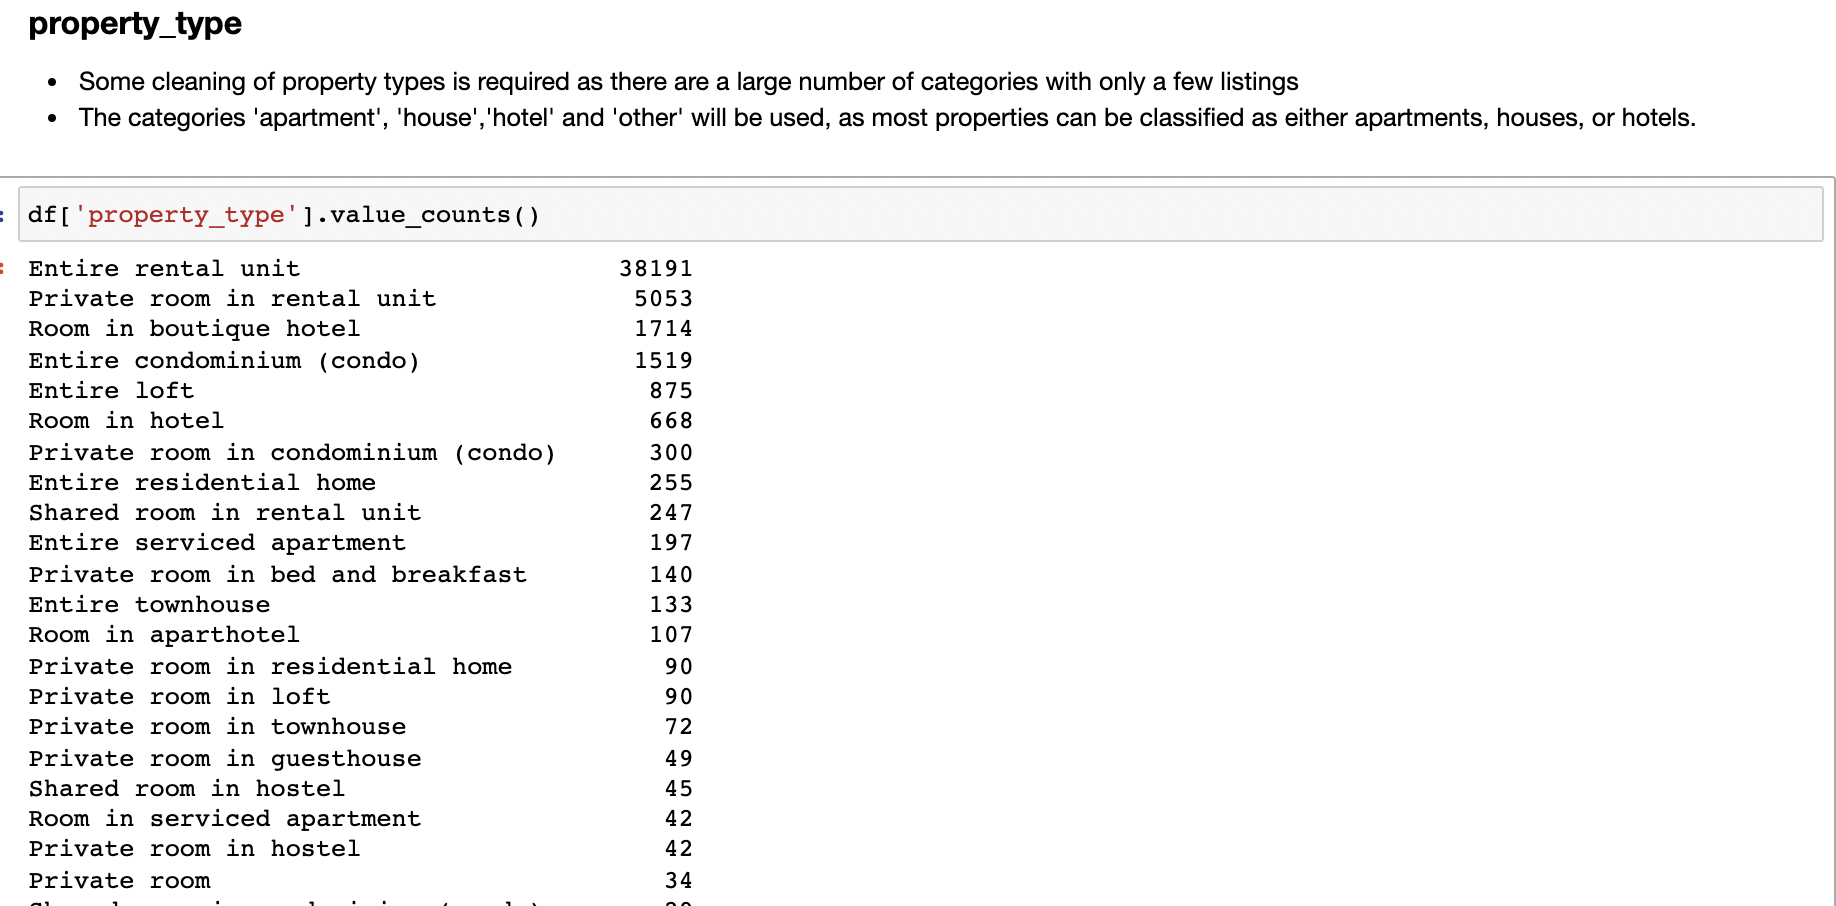
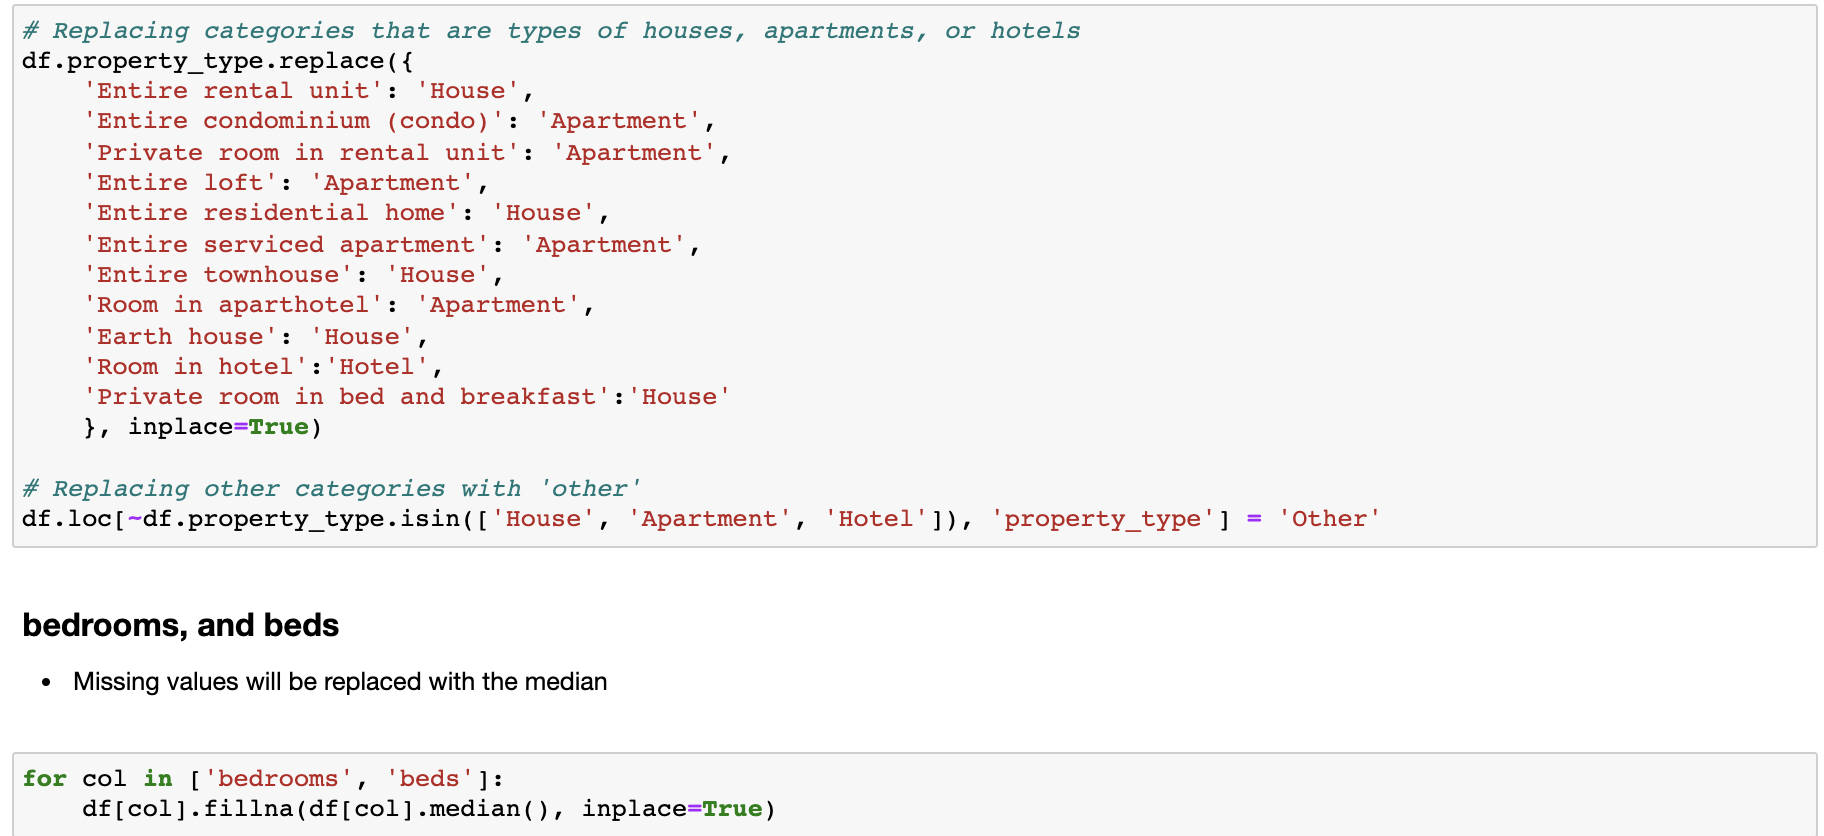
- property_type - type of property, e.g. house, apartement, or hotel
- room_type - type of listing, e.g. entire home, private room or shared room
- bathrooms - number of bathrooms
- beds - number of beds
- amenities - list of amenities
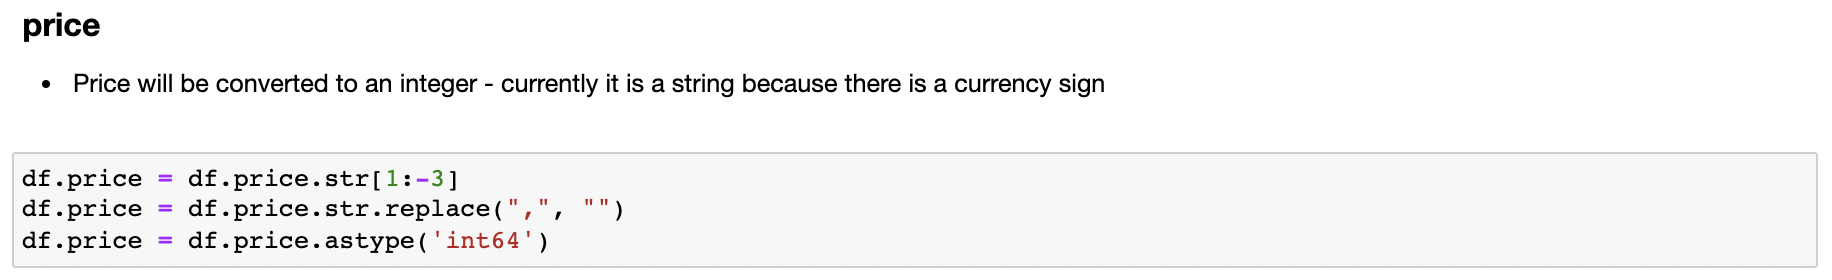
- price - nightly advertised price
- minimum_nights - the minimum length of stay
- maximum_nights - the maximum length of stay
- availability_30 - how many nights are available to be booked in the next 30 days
- availability_60 - how many nights are available to be booked in the next 60 days
- availability_90 - how many nights are available to be booked in the next 90 days
- availability_365 - how many nights are available to be booked in the next 365 days
- number_of_reviews - the number of reviews left for the property
- number_of_reviews_ltm - the number of reviews left for the property in the last twelve months
- first_review - the date of the first review
- last_review - the date of the most recent review
- review_scores_rating - guests can score properties overall from 1 to 5 stars
- review_scores_accuracy - guests can score the accuracy of a property's description from 1 to 5 stars
- review_scores_cleanliness - guests can score a property's cleanliness from 1 to 5 stars
- review_scores_checkin - guests can score their check-in from 1 to 5 stars
- review_scores_communication - guests can score a host's communication from 1 to 5 stars
- review_scores_location - guests can score a property's location from 1 to 5 stars
- review_scores_value - guests can score a booking's value for money from 1 to 5 stars
- reviews_per_month - calculated field of the average number of reviews left by guest each month
Cleaning individual variables
After identifying those variables that I expected to prove most useful in my analysis, I still had to clean the data and convert some data to numerical data types.
Observations:
- Host response time proved an unreliable indicator of experience on the platform as the majority of cells in this varaible were null/unknown. For the data that was provided, most hosts returned communication within an hour to a few hours.
- As trust and communication between hosts and guests is a key component of the platform, the mean host response rate was 89.0% and the median response rate was 100.0%. 62.1% of hosts had 100% response rates to guest inquiries.
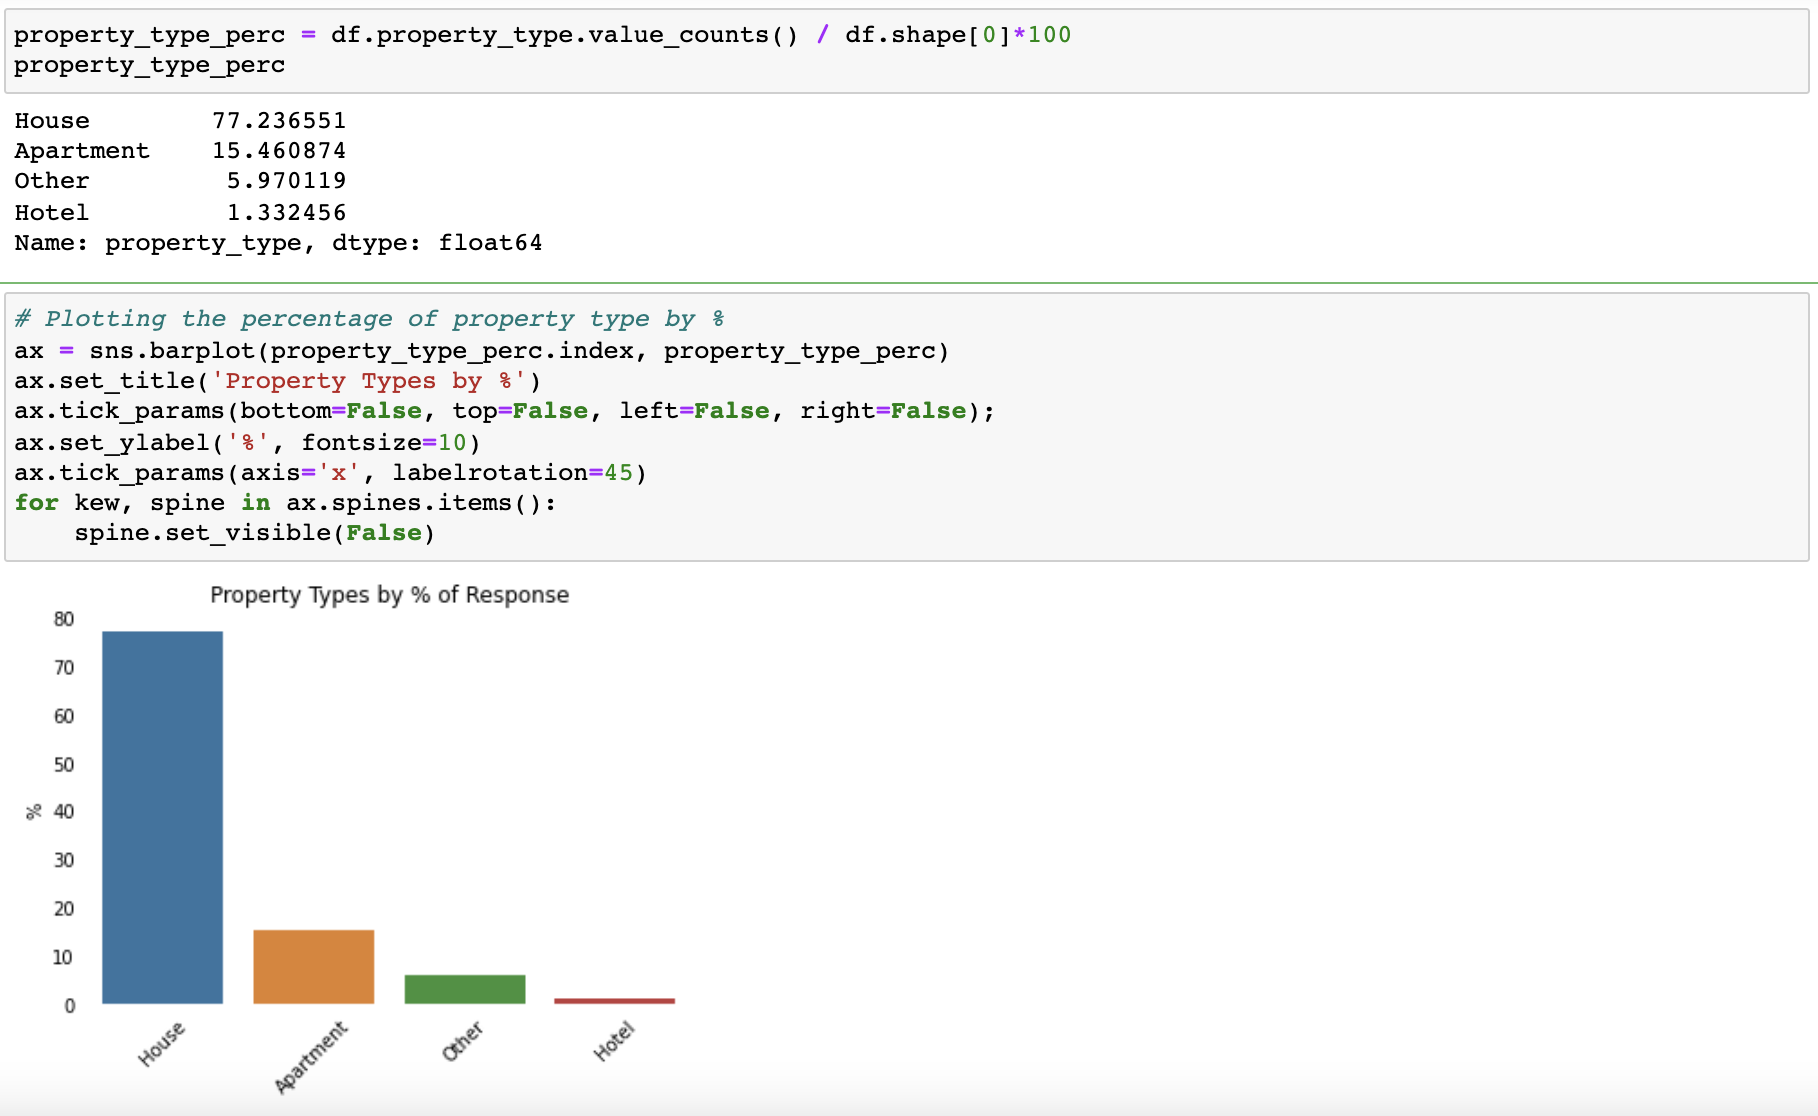
- The majority of units were classified as entire rental units, followed next by private rooms in rental units. The majority of property types were houses/residences, followed next by apartments and then hotels.
Appendix 2: Feature analysis
Appendix 3: Regression analysis
Multiple regression provided a much more reliable exercise in predicting the pricing of units based on several features from the dataset.