How many Python files did I create in order to become Pythonic?
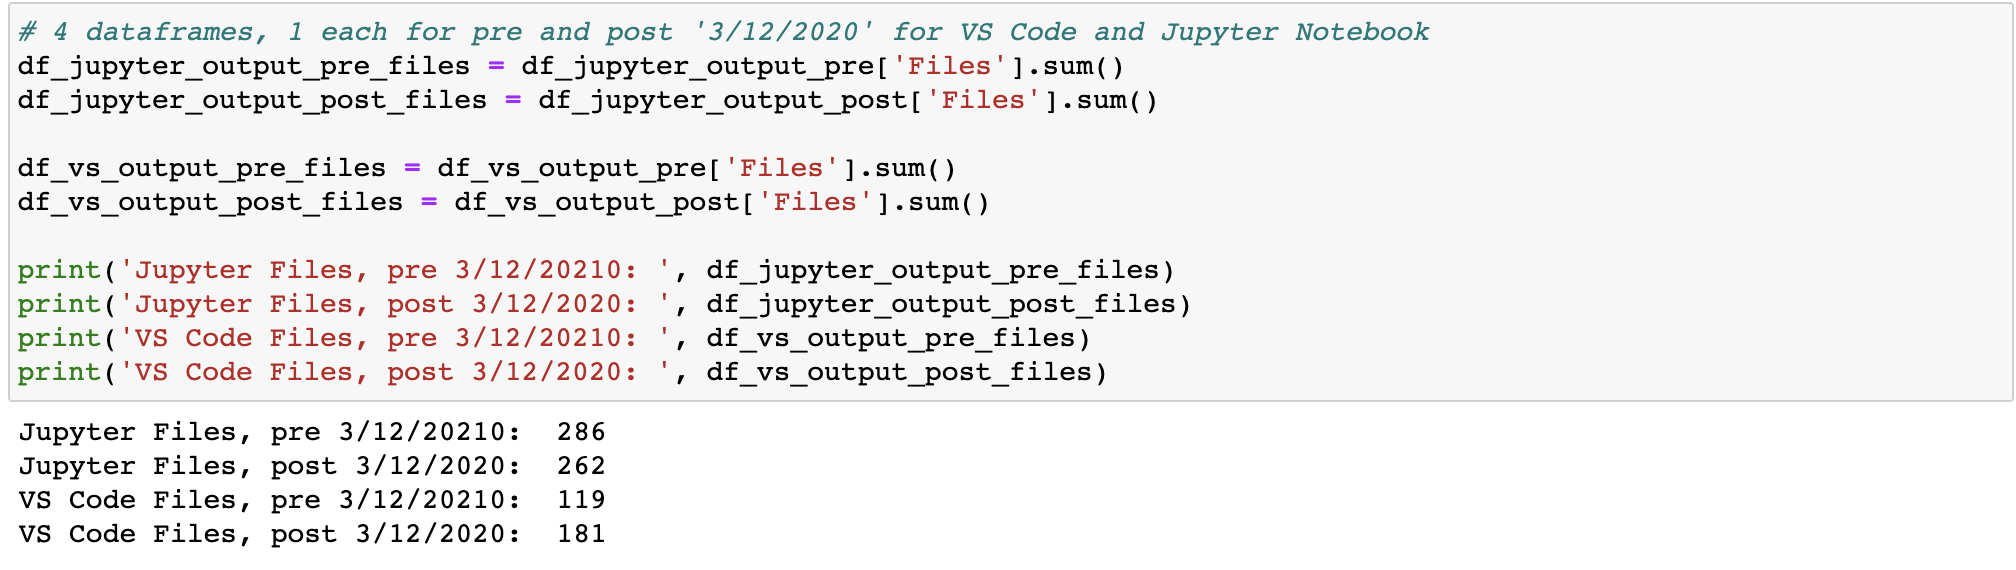
Answer: 286 Jupyter files pre-COVID, 263 files post-COVID; 119 Visual Studio Python files pre-COVID, 181 Python files post-COVID
September 11, 2021
Context: The first time it sunk in for me that COVID-19 was more than something trivial was the night of March 11, 2020 and it all occured in a span of about 35 minutes. Obviously I was aware of the virus - rising uncertainty about the contagion had ended the 11-year bull market run, with stocks down over 20% from prior peaks in February. Like any other evening on the 11th, a Wednesday, I was watching baskeball before heading to bed. Shortly after 9:00 PM, actor Tom Hanks took to social media that he and his wife had tested positive for the virus.
Then, at 9:27 PM, hyper-vigilant NBA reporter and twitter fiend Shams Charania reported
that Utah Jazz player Rudy Gobert had tested positive for the virus. (Earlier in the day, as part of a pre-game media session, Gobert had mocked the at-the-time hyperbole of the virus and touched all open microphones at the podium with his massive hands). Charania followed up minutes later with another tweet, reporting that the NBA season had been indefinitely suspended. The sequence of events - Tom Hanks, Rudy Gobert with the red breaking news banner on ESPN.com, shortly followed by the NBA season suspended, all in a span of 32 minutes and which I followed in real time - sounded alarm bells in my head.
And then we all stayed home, and in my free time, over countless hours on learning platforms such as udemy and Datacamp; hundreds of videos watched on YouTube; and intensive practice writing code for projects, I learned python.
Twenty years after 9/11, and 548 days after I began my intensive python learning binge, I was curious to know how much time I had spent using and learning python during the pandemic, and I knew the exact tool to help me do it: python.
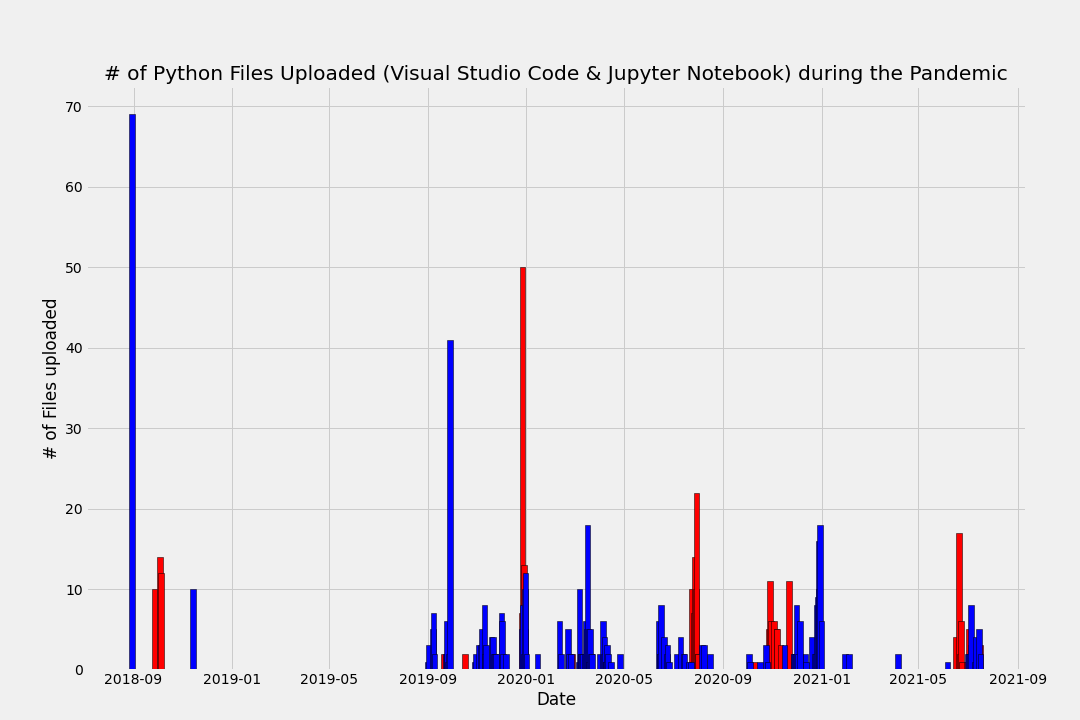
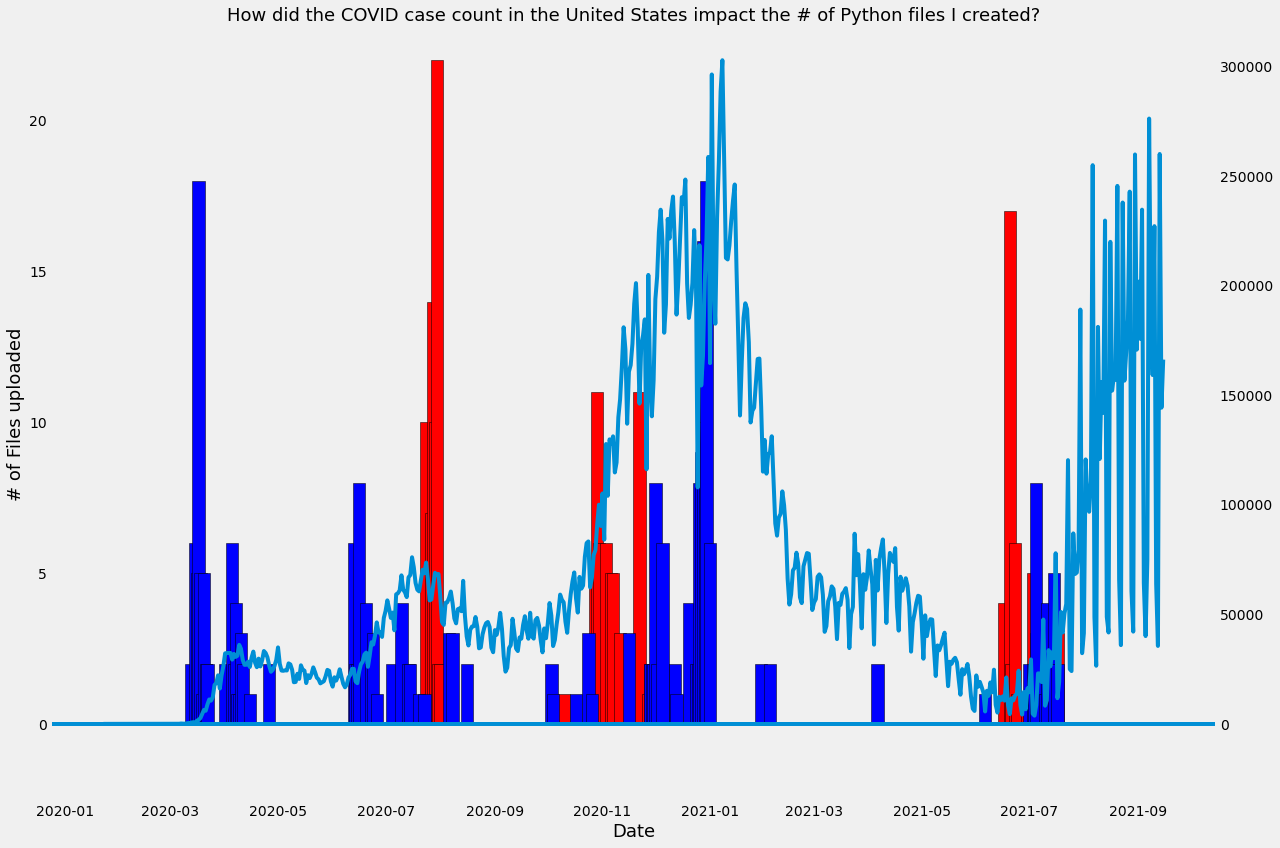
Below is a visualization of all the python files I created and the date the file was created. The two data sets refer to Jupyer Notebook files (".ipynb.") and those created on Visual Studio Code (".py"). The complete code can be accessed at this link here, but below I have replicated the most important parts of the code.
So if the question is "how many python files did I create starting on March 12, 2020", then here is my thought process: first, that I have to identify, count, and sum up files created both on Jupyter Notebooks, and Visual Studio Code, and I also want to save the date the file was created to meet the question's parameters. I need to be able to search for all files in all folders and subfolders that end in a defined suffix, and I need to collect all relevant data points and present in tabular format. After assessing the quality of the data and identifying reasons for outliers, I need to visualize and present the data in a conclusive and evident format. Only then can I start to propose answers to questions.
Initial look at the data set:
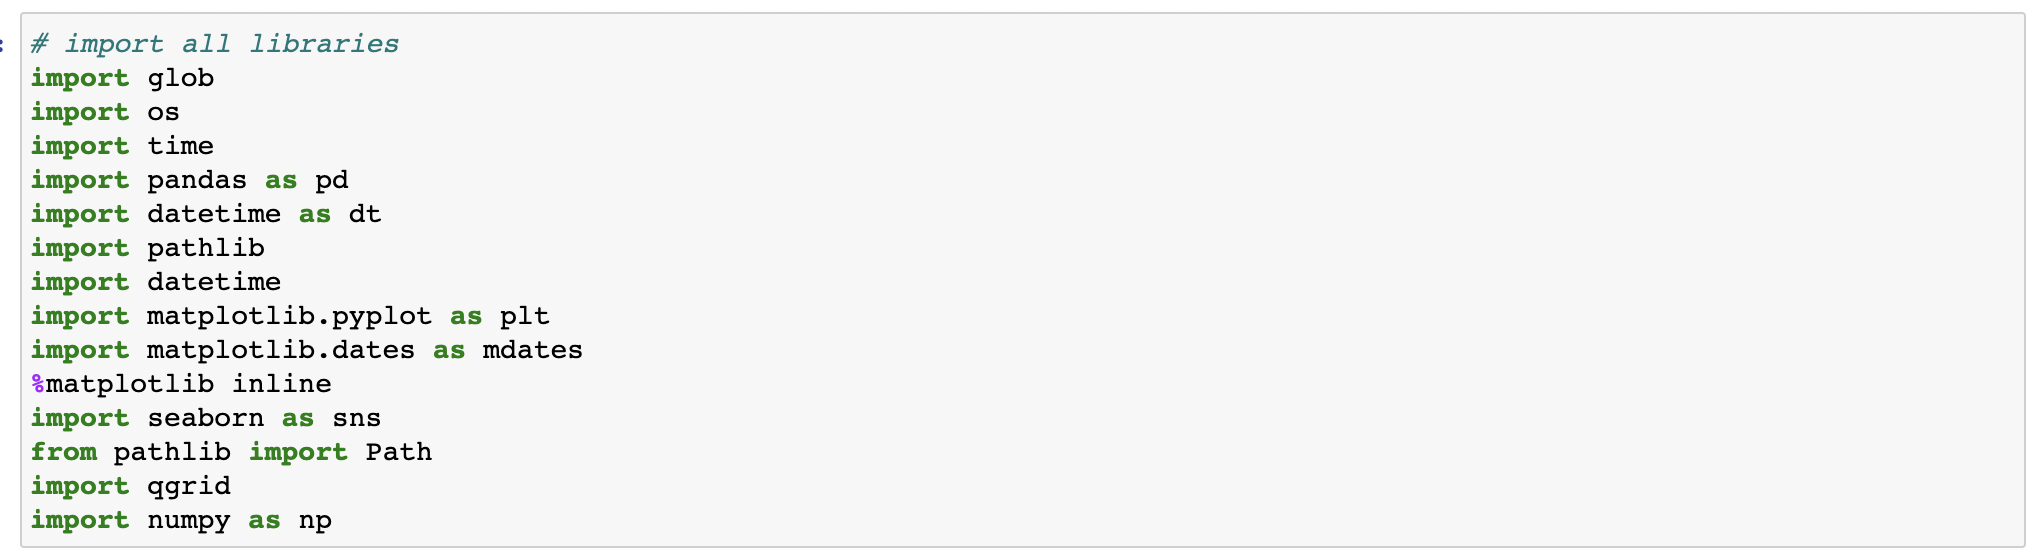
I start by importing all packages and libraries:
And then I locate the proper file directory:

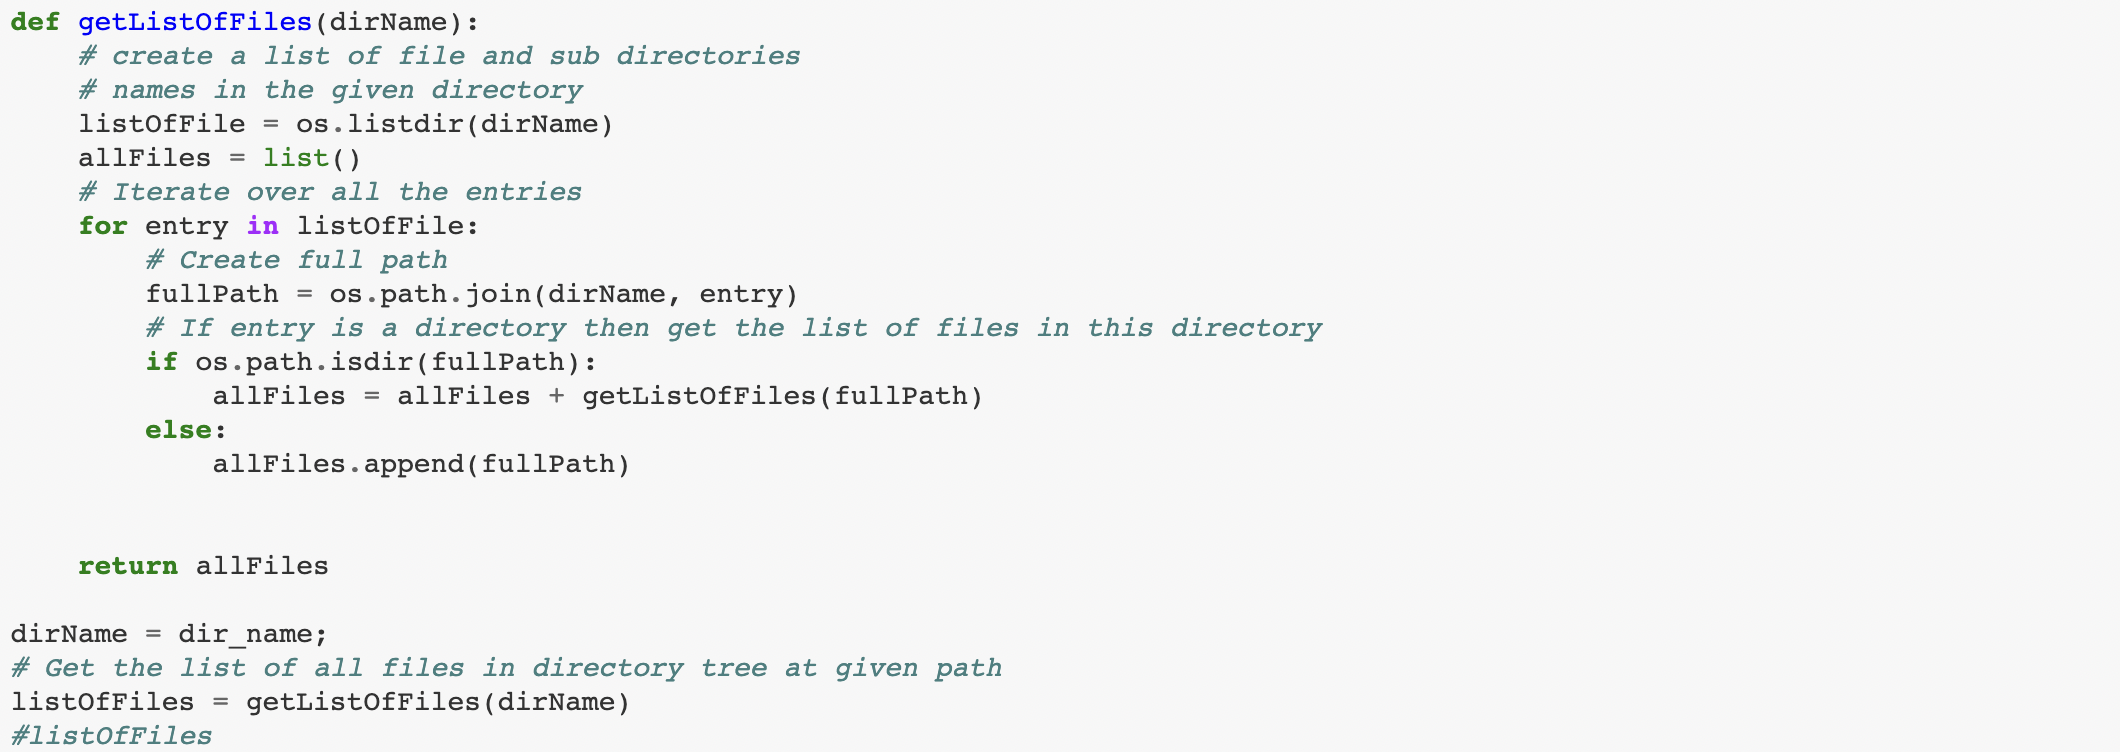
Then I write a function using os and pathlib to iterate over all files and create a list of all files in all subfolders in all directories in the root:
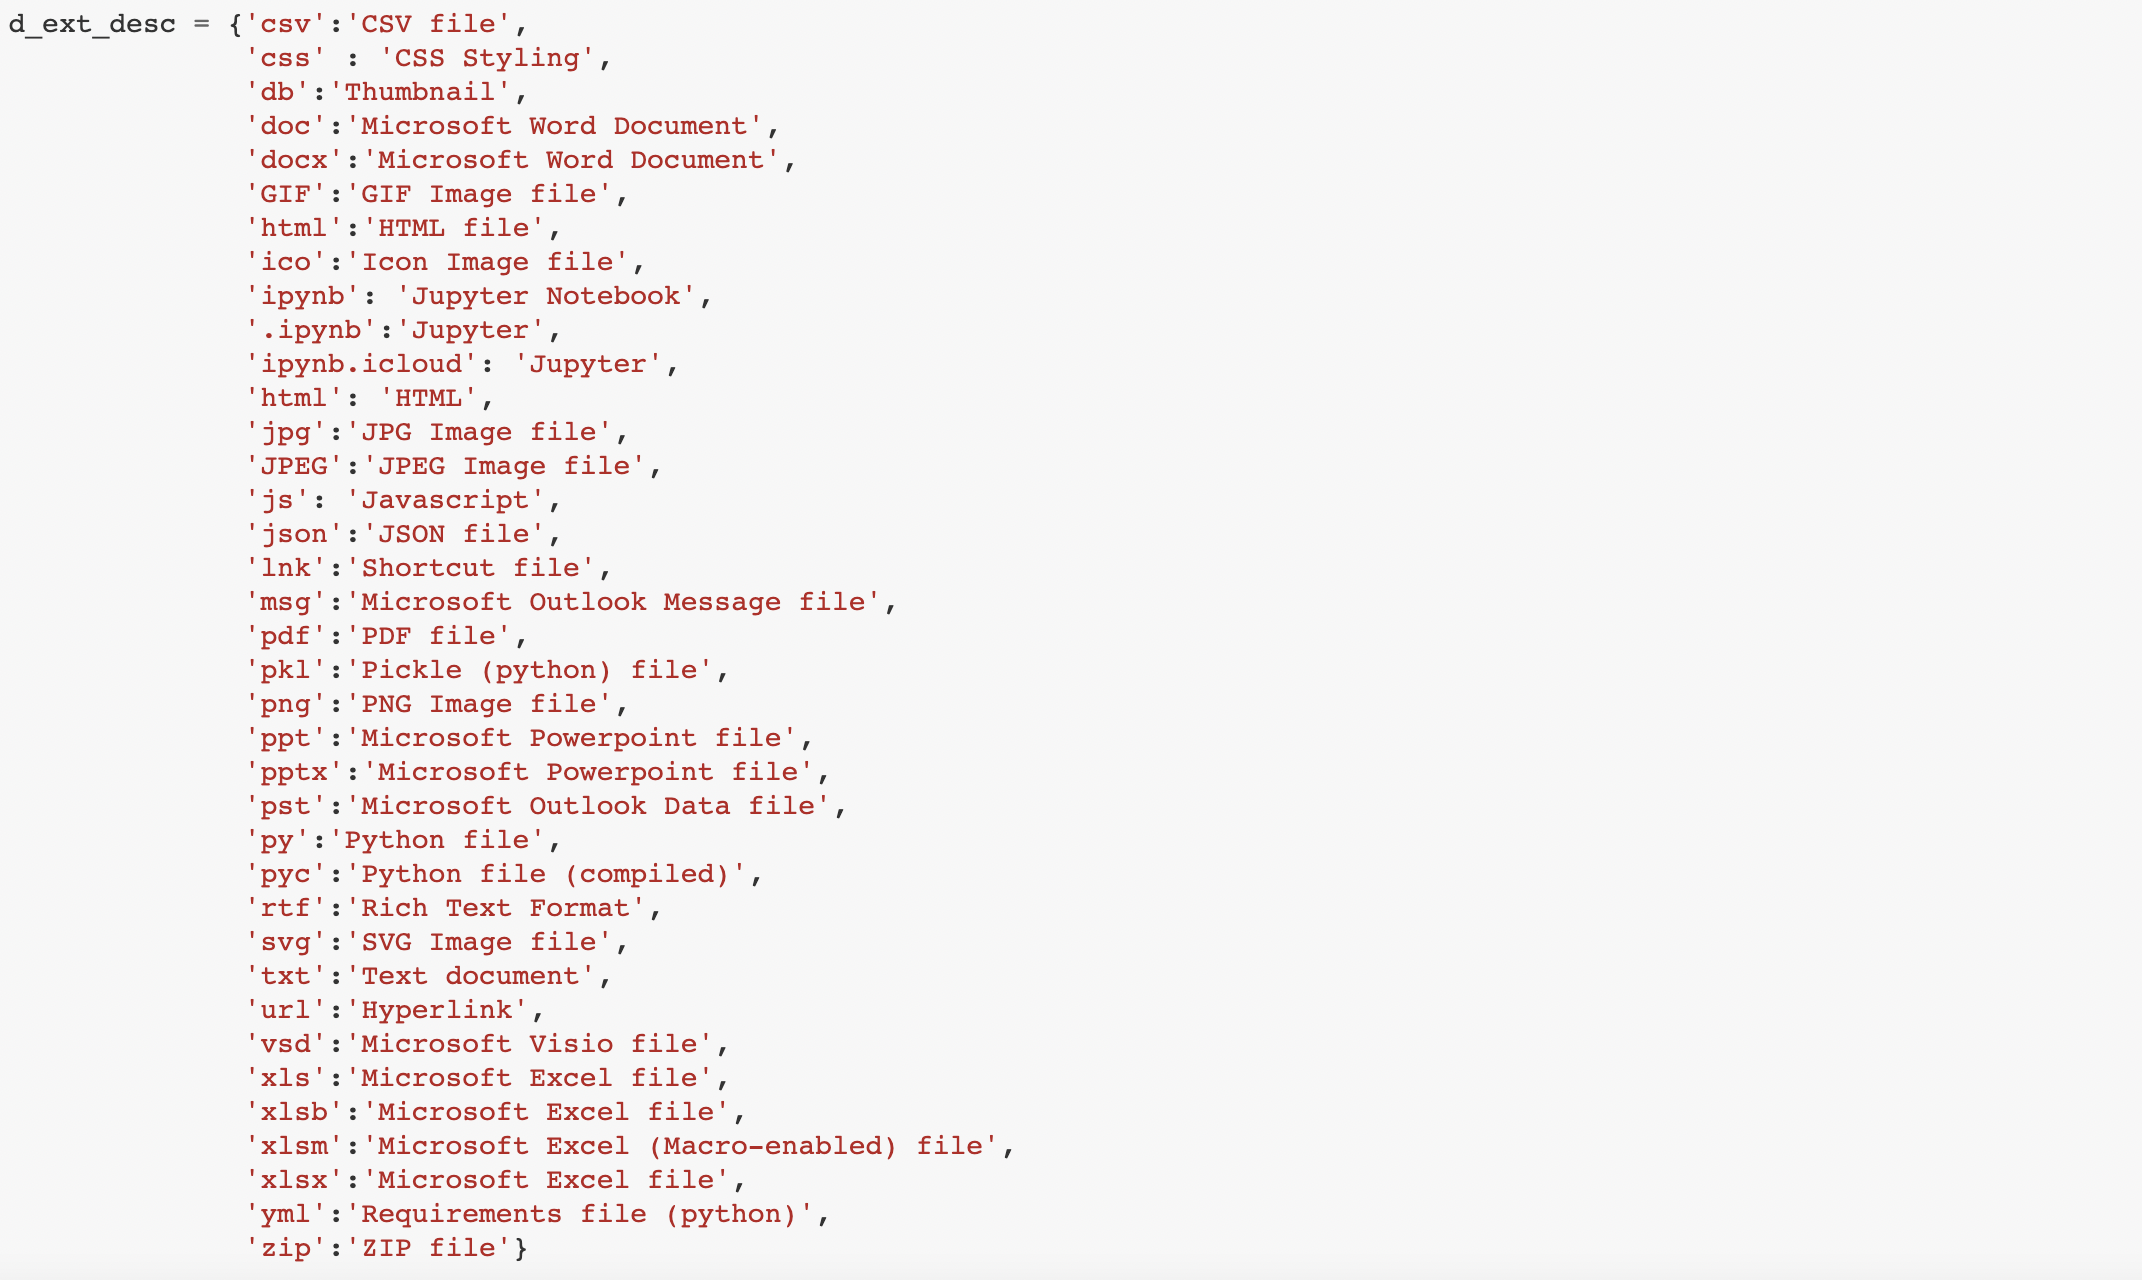
Next, I create a dictionary for each specific file type:
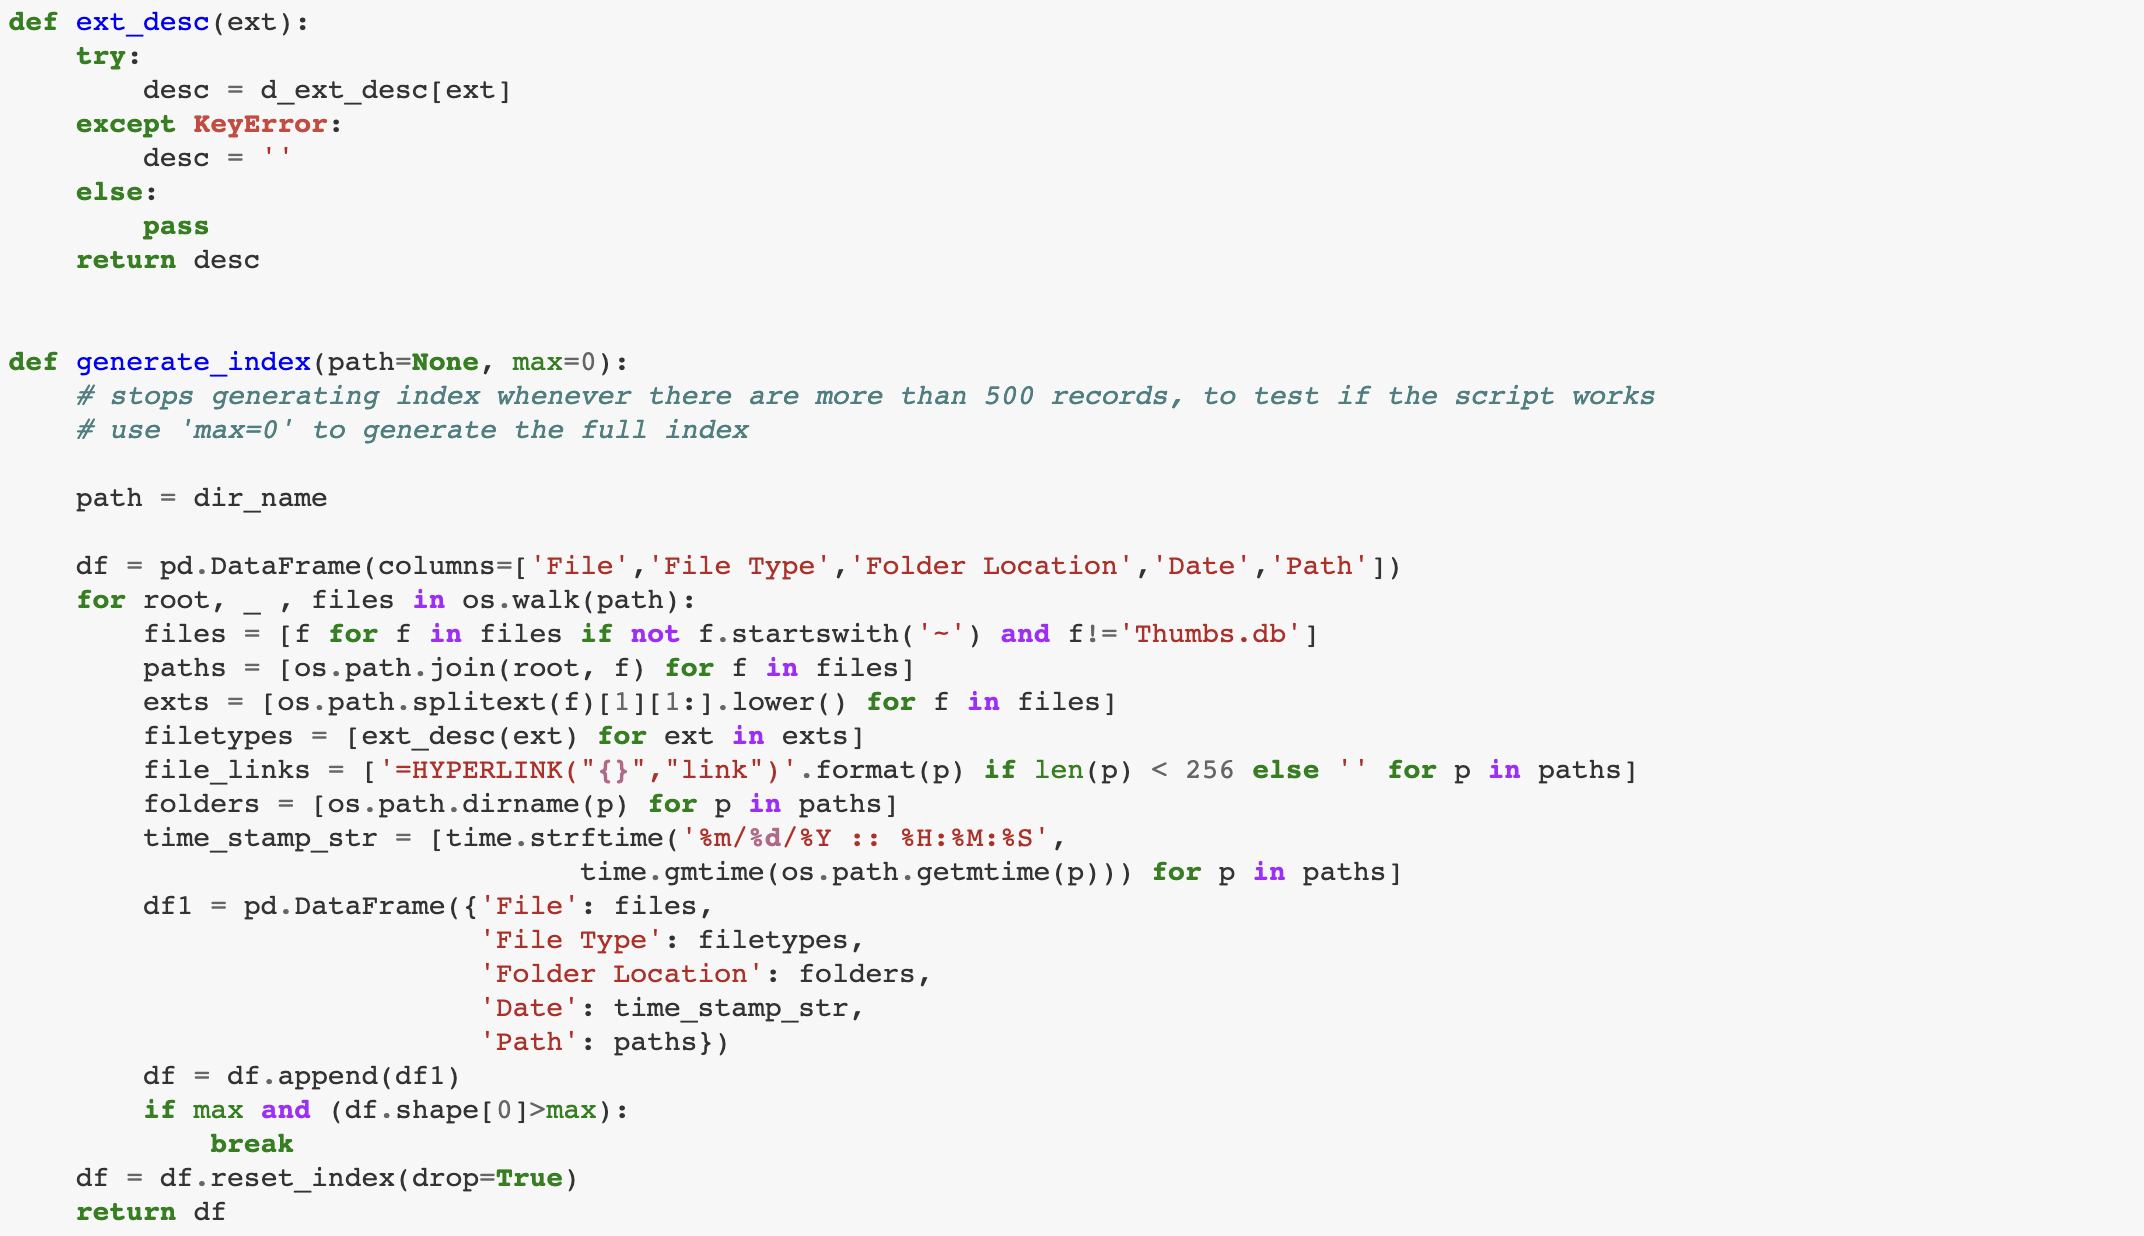
Then I write a function that filters all files and saves as a dataframe:
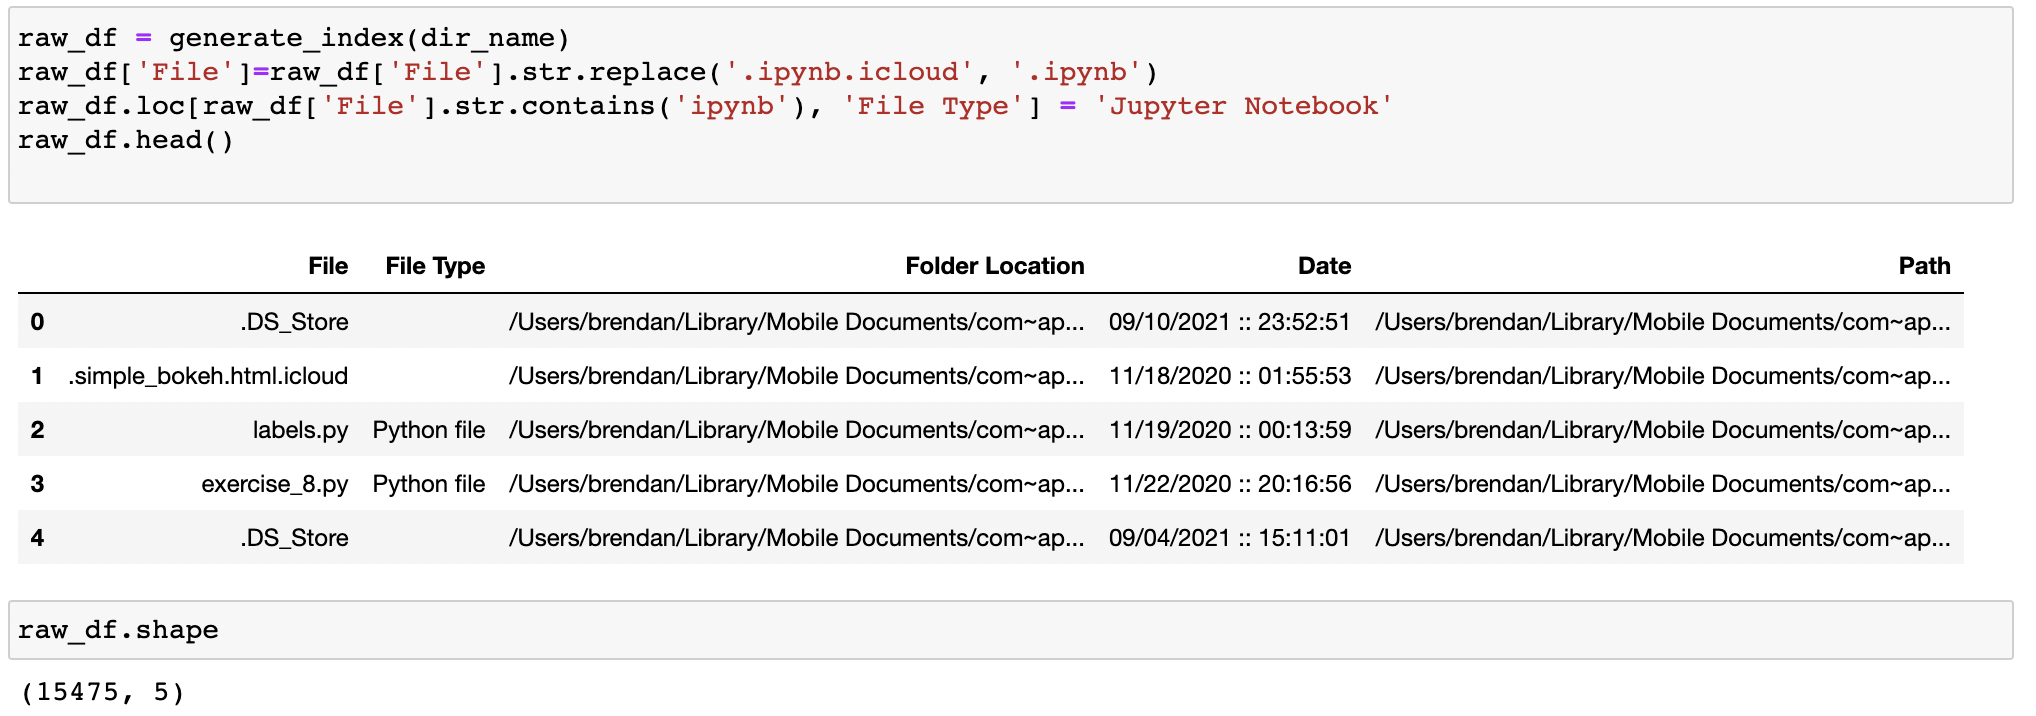
After running the function and renaming data attributes, I use the '.shape' method. The inital file count across the root directory is 15,475.
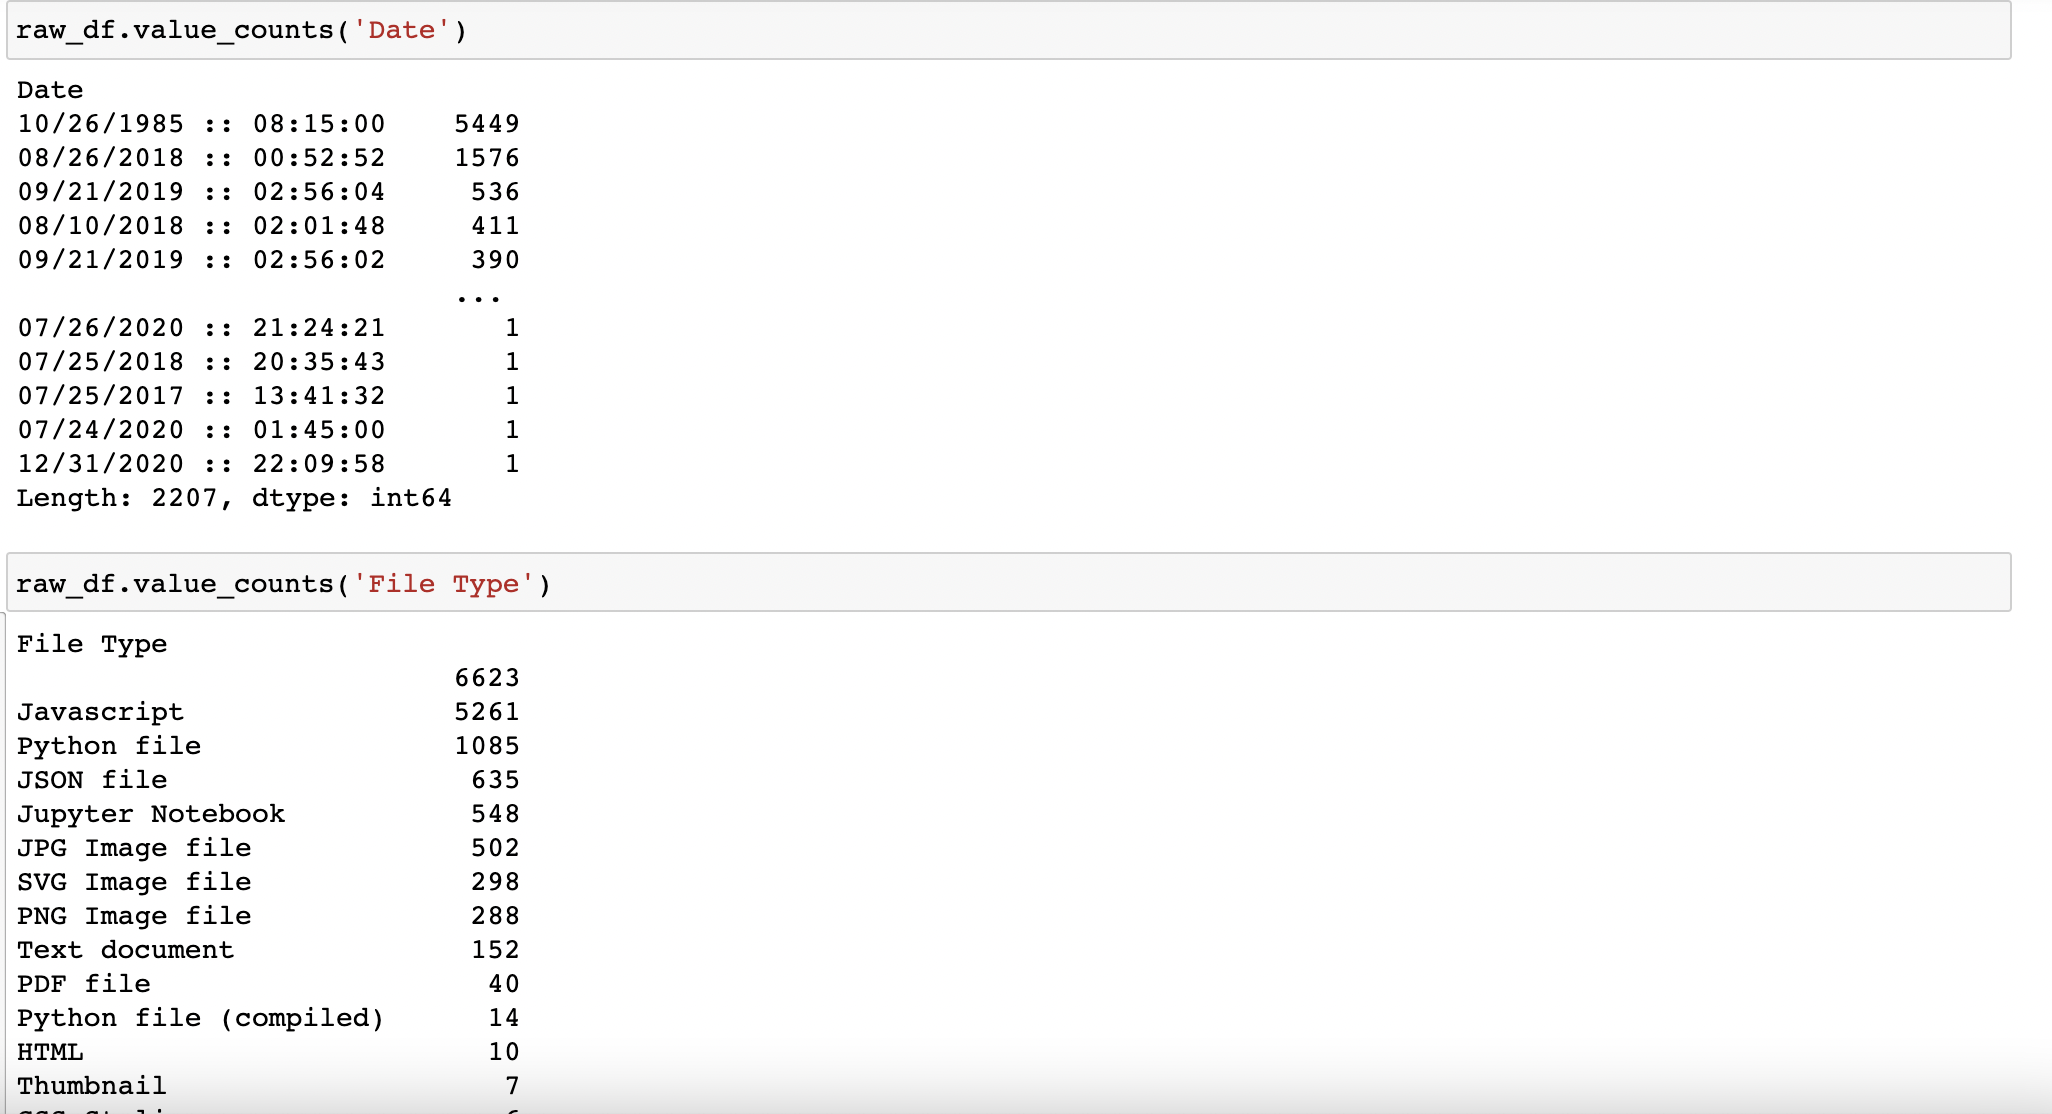
Then I use the built-in value counts function for a high level view of the files list by date and file type. And I take note of the outliers. Immediately, the 5,449 files created exactly 2 years and 1 hour before my birth stick out as noisy data but requires further analysis.
A more detailed look at the data, and identifying reasons for outliers:
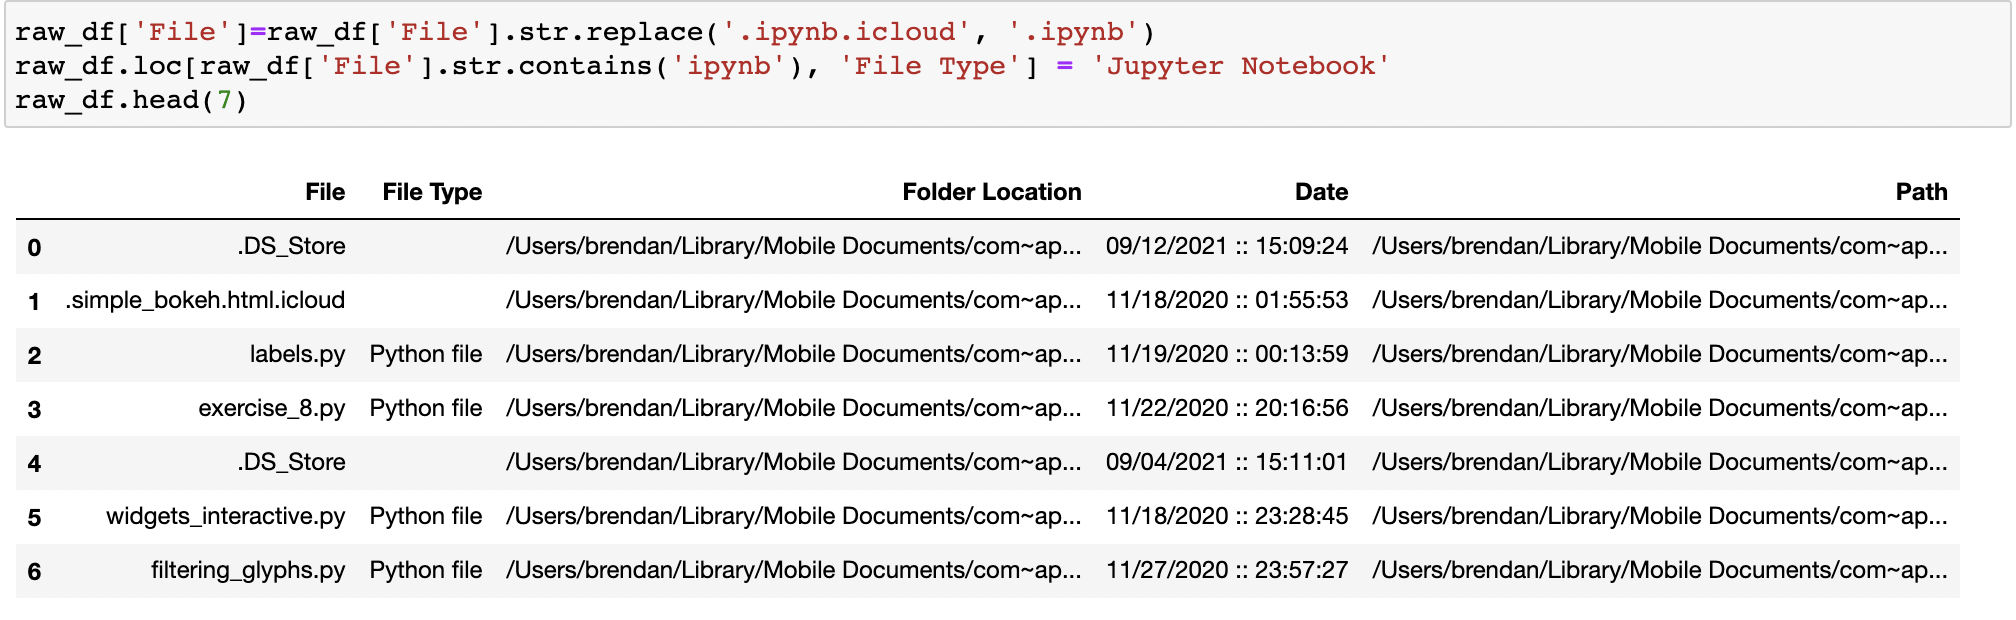
First, as part of an effort to refine and clean the data, I need to differentiate between those files accessed on Jupyer Network from those accessed on Visual Studio Code, as the filepaths are different for each source. I effectively need to split the data into 3 buckets: Python files that end in '.py', which indicates Visual Studio Code; Python files that end in '.ipynb', which indicates the file was created on Jupyter Notebook; and all other system files. Below is code used to reclassify certain file names as either 'Python file' or 'Jupyter Notebook', based on the filepath.
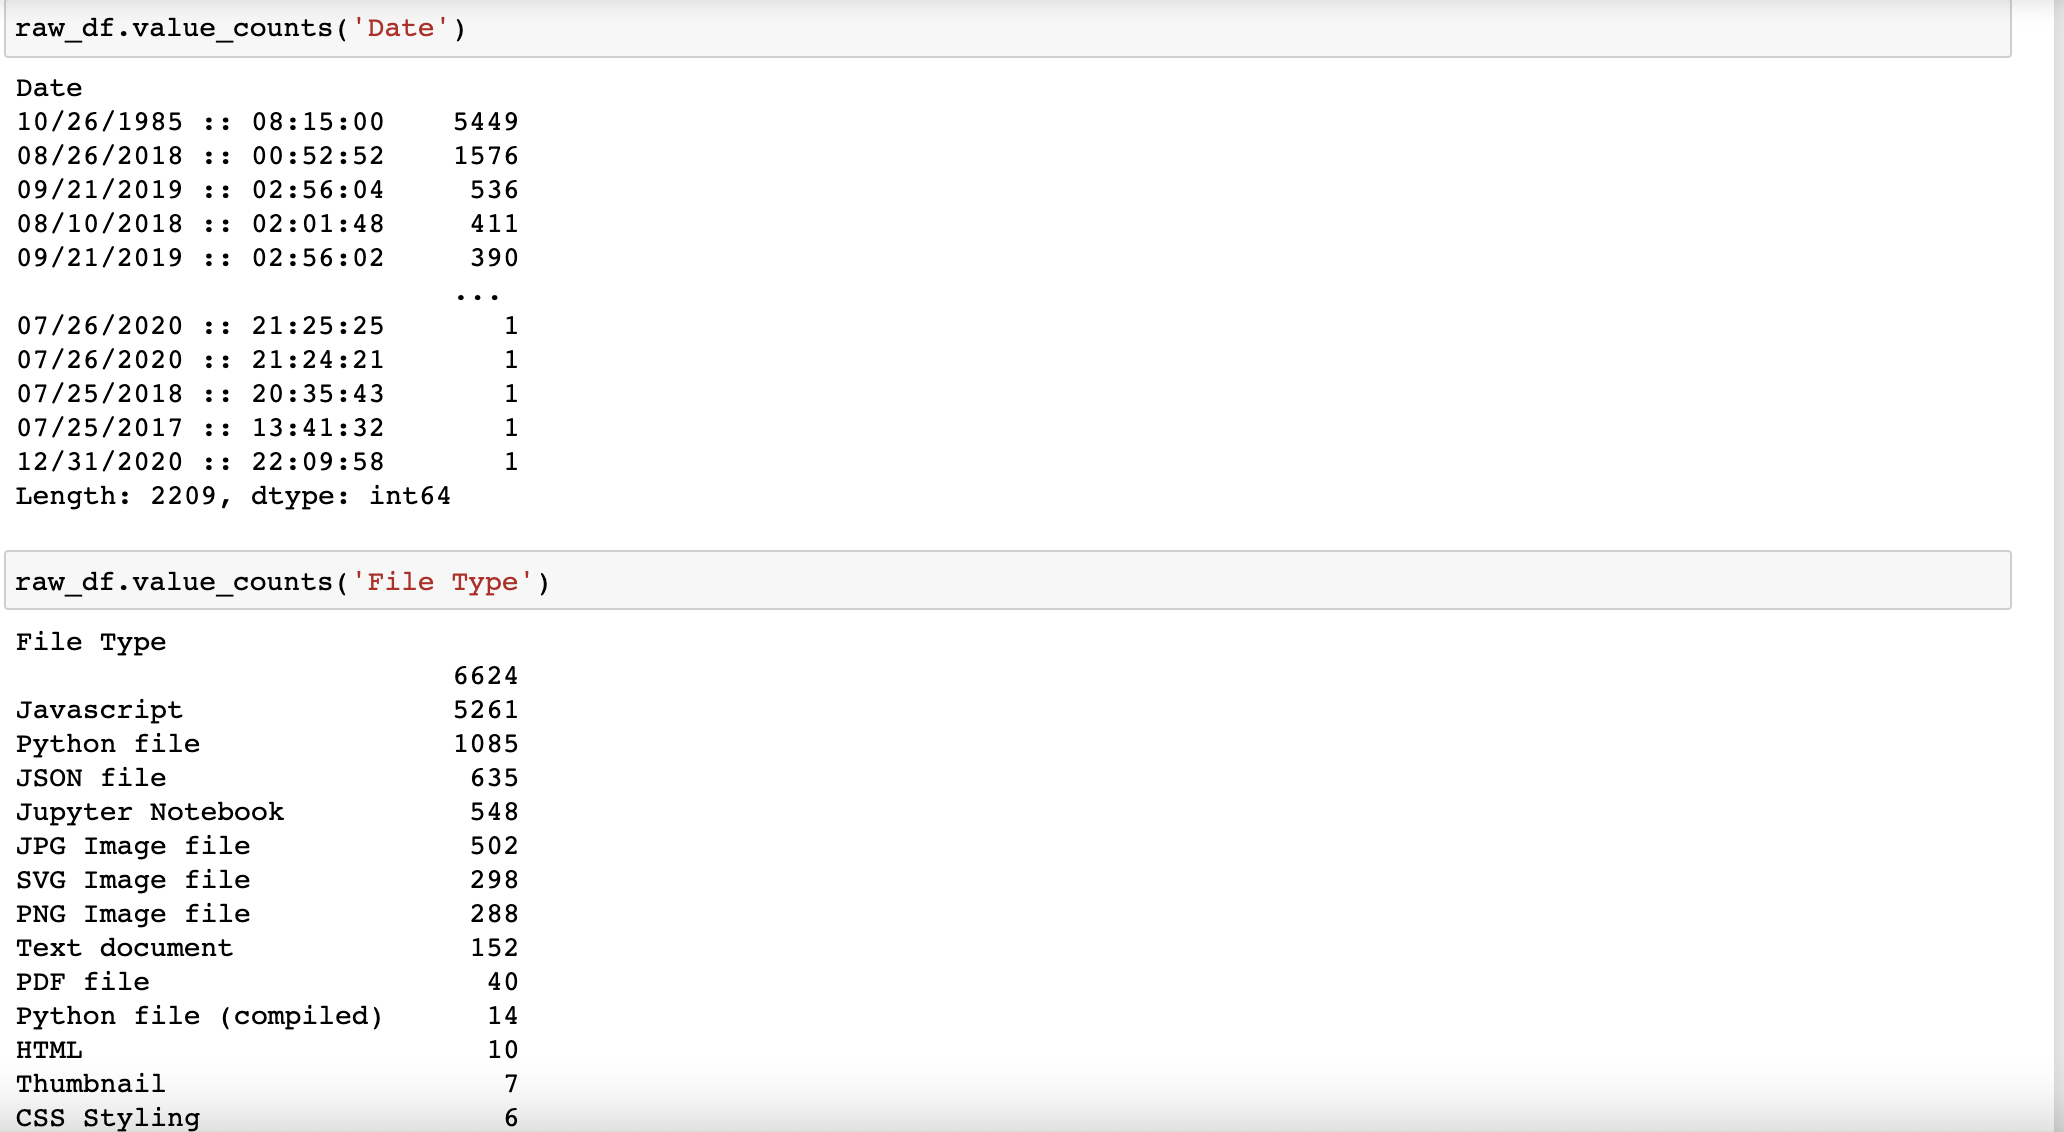
Note that we still have the same total # of files as before at ~15,475:
But now I need to investigate the outliers and why certain dates have hundreds of files saved to my system. I'll need to further investigate files uploaded on 10/26/1985; 8/26/2018; 9/21/2019; and 8/10/2018, among others. The next step is to subset the raw_df by file type ('Python File') and by the suspect dates.
October 26, 1985 -- 147 python files excluded from dataset
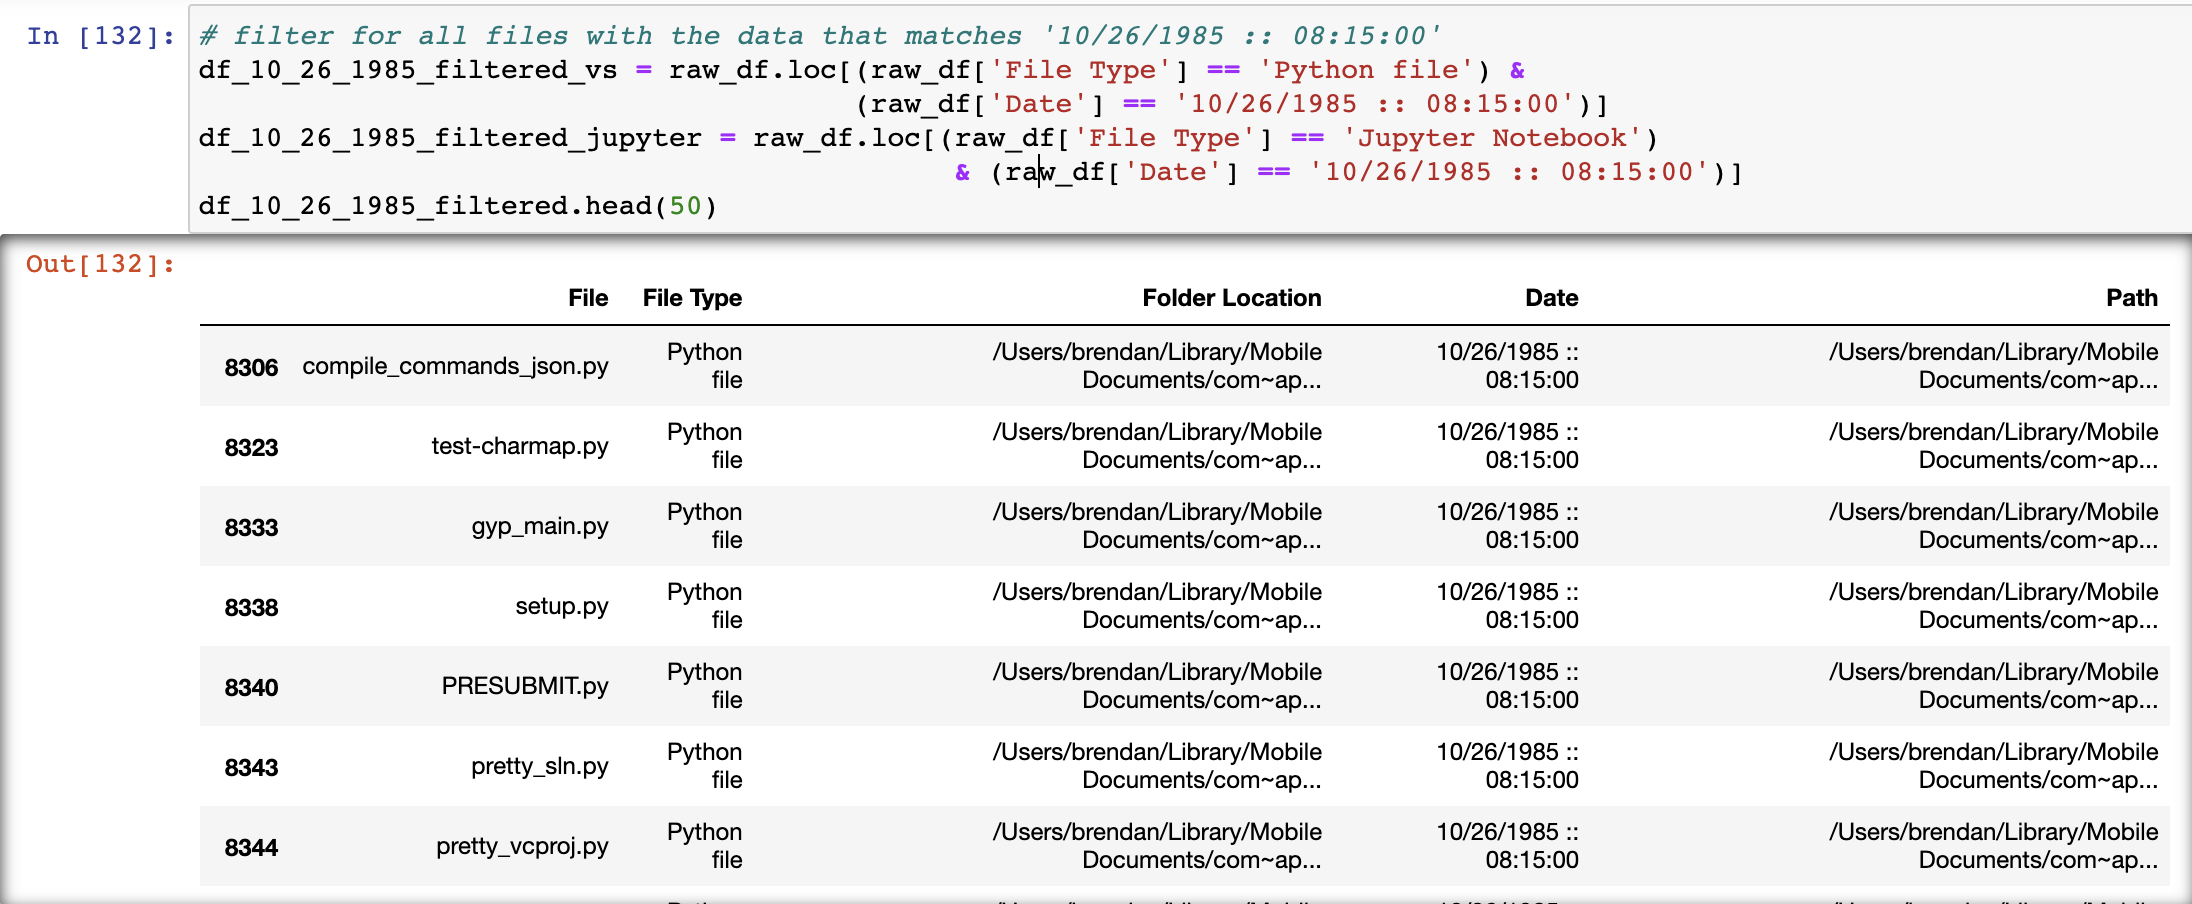
I subset the raw_df which contains all files and I filter for python files (".py" and ".ipynb") and those that match the date of "10/26/1985 :: 08:15:00". The result of matching this criteria is a dataframe consisting of 147 entries and 5 columns. Analysis of the files indicate these python files are interdependencies related to the development of the python language, and not files I created.
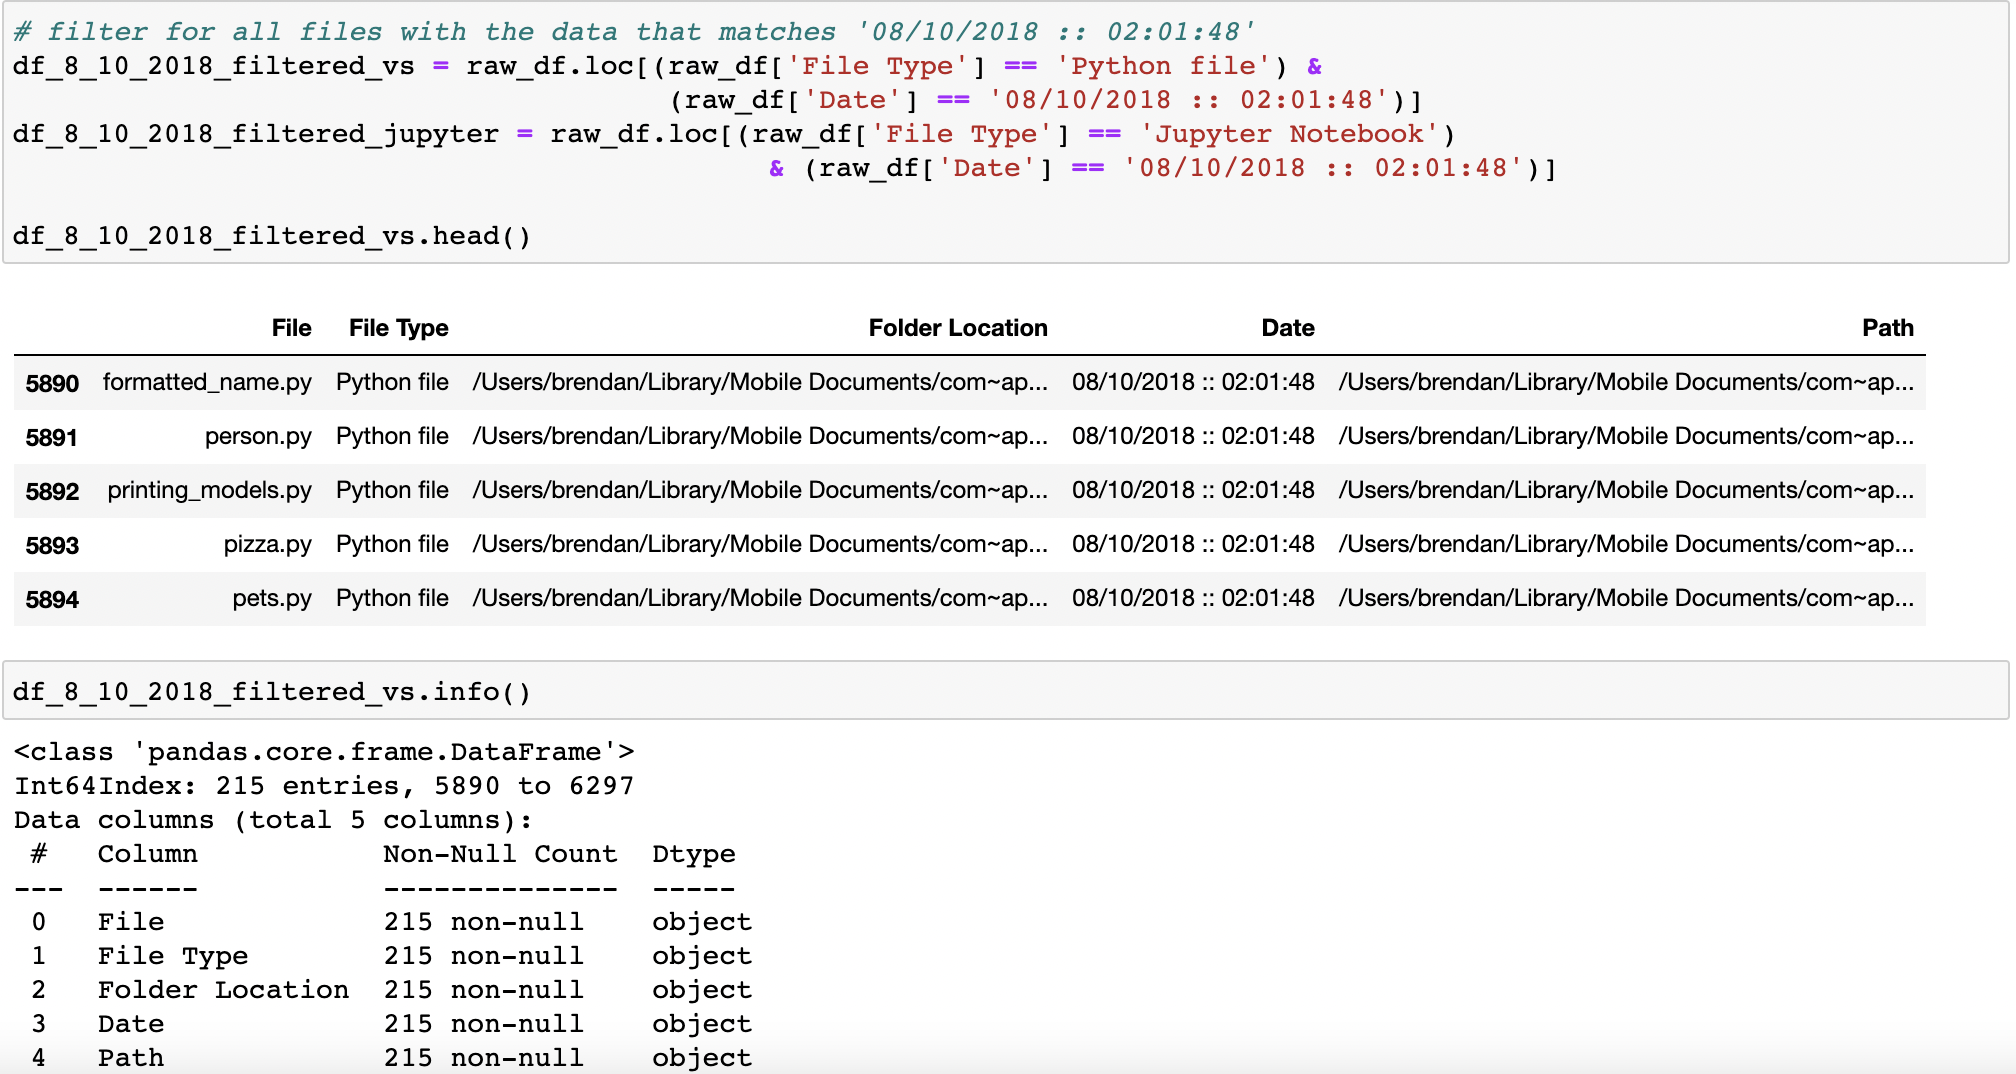
August 10, 2018 -- 215 python files excluded from dataset
I perform the same analysis for files created on August 10, 2018, which was around the time I first downloaded python packages. The result is a dataframe of 215 entries and 5 columns. Again, this was around the time I first downloaded Python, and an analysis of file names and filepaths leads me to beleive these file are interdependencies. So while crucial, they are excluded from the data.
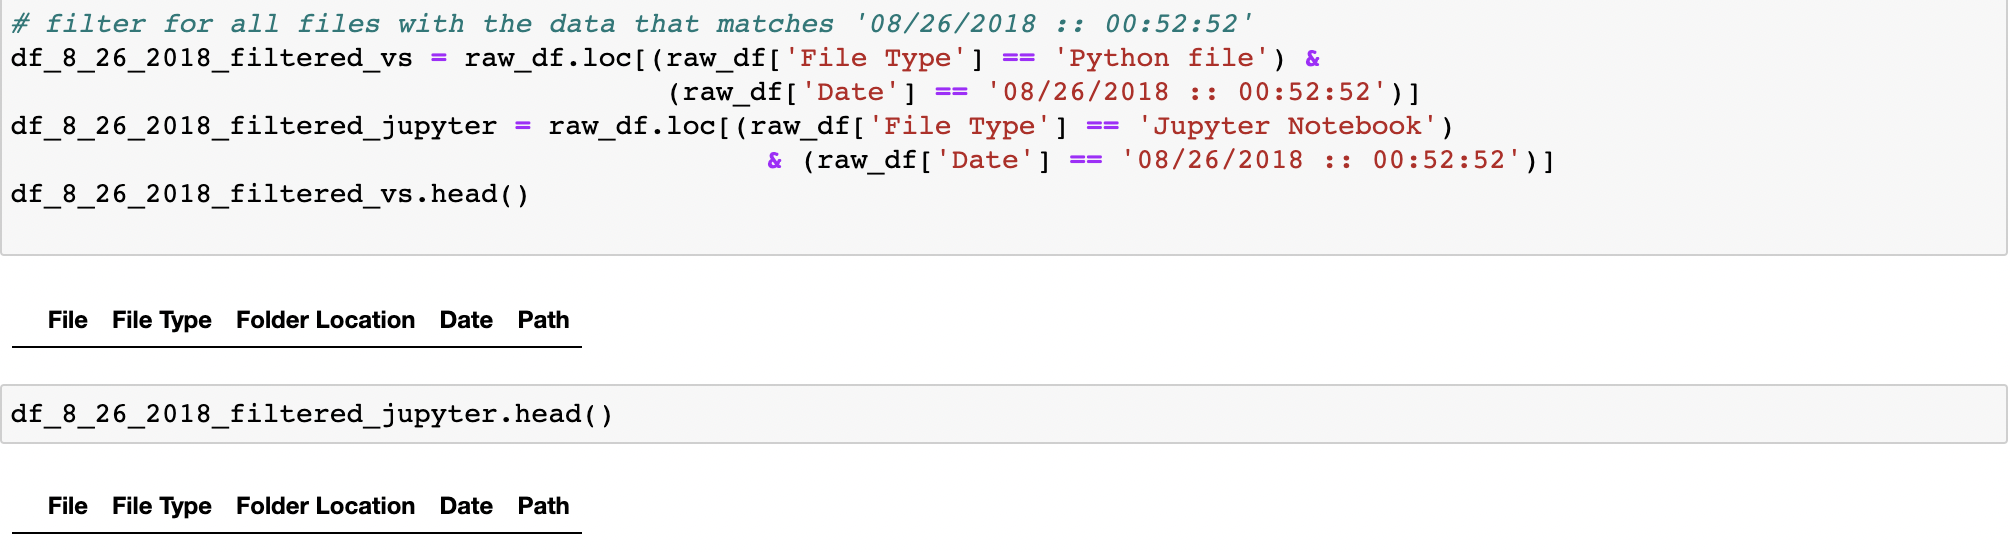
August 26, 2018-- 0 Python files excluded from dataset
Similar analysis is run for files created on August 26, 2018. As it turns out, no files created on this date were python files. This data is also excluded.
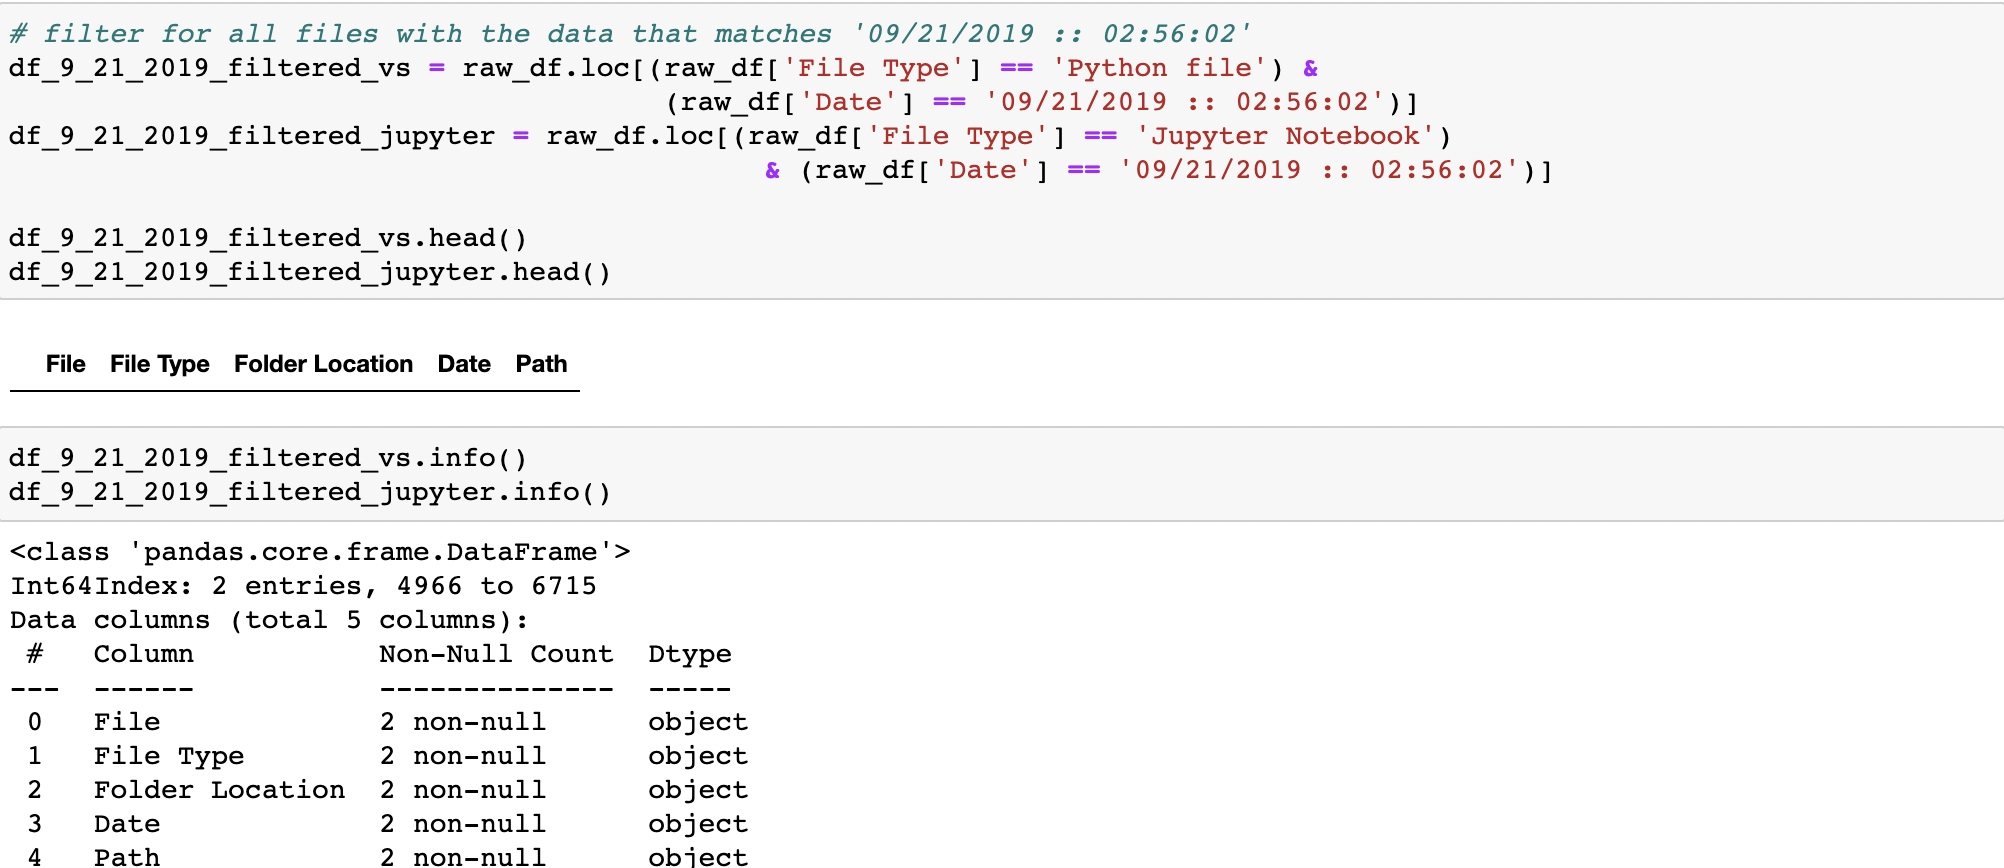
September 21, 2019 -- 0 Python files excluded from dataset
No files created on this date were python files. This data is also excluded.
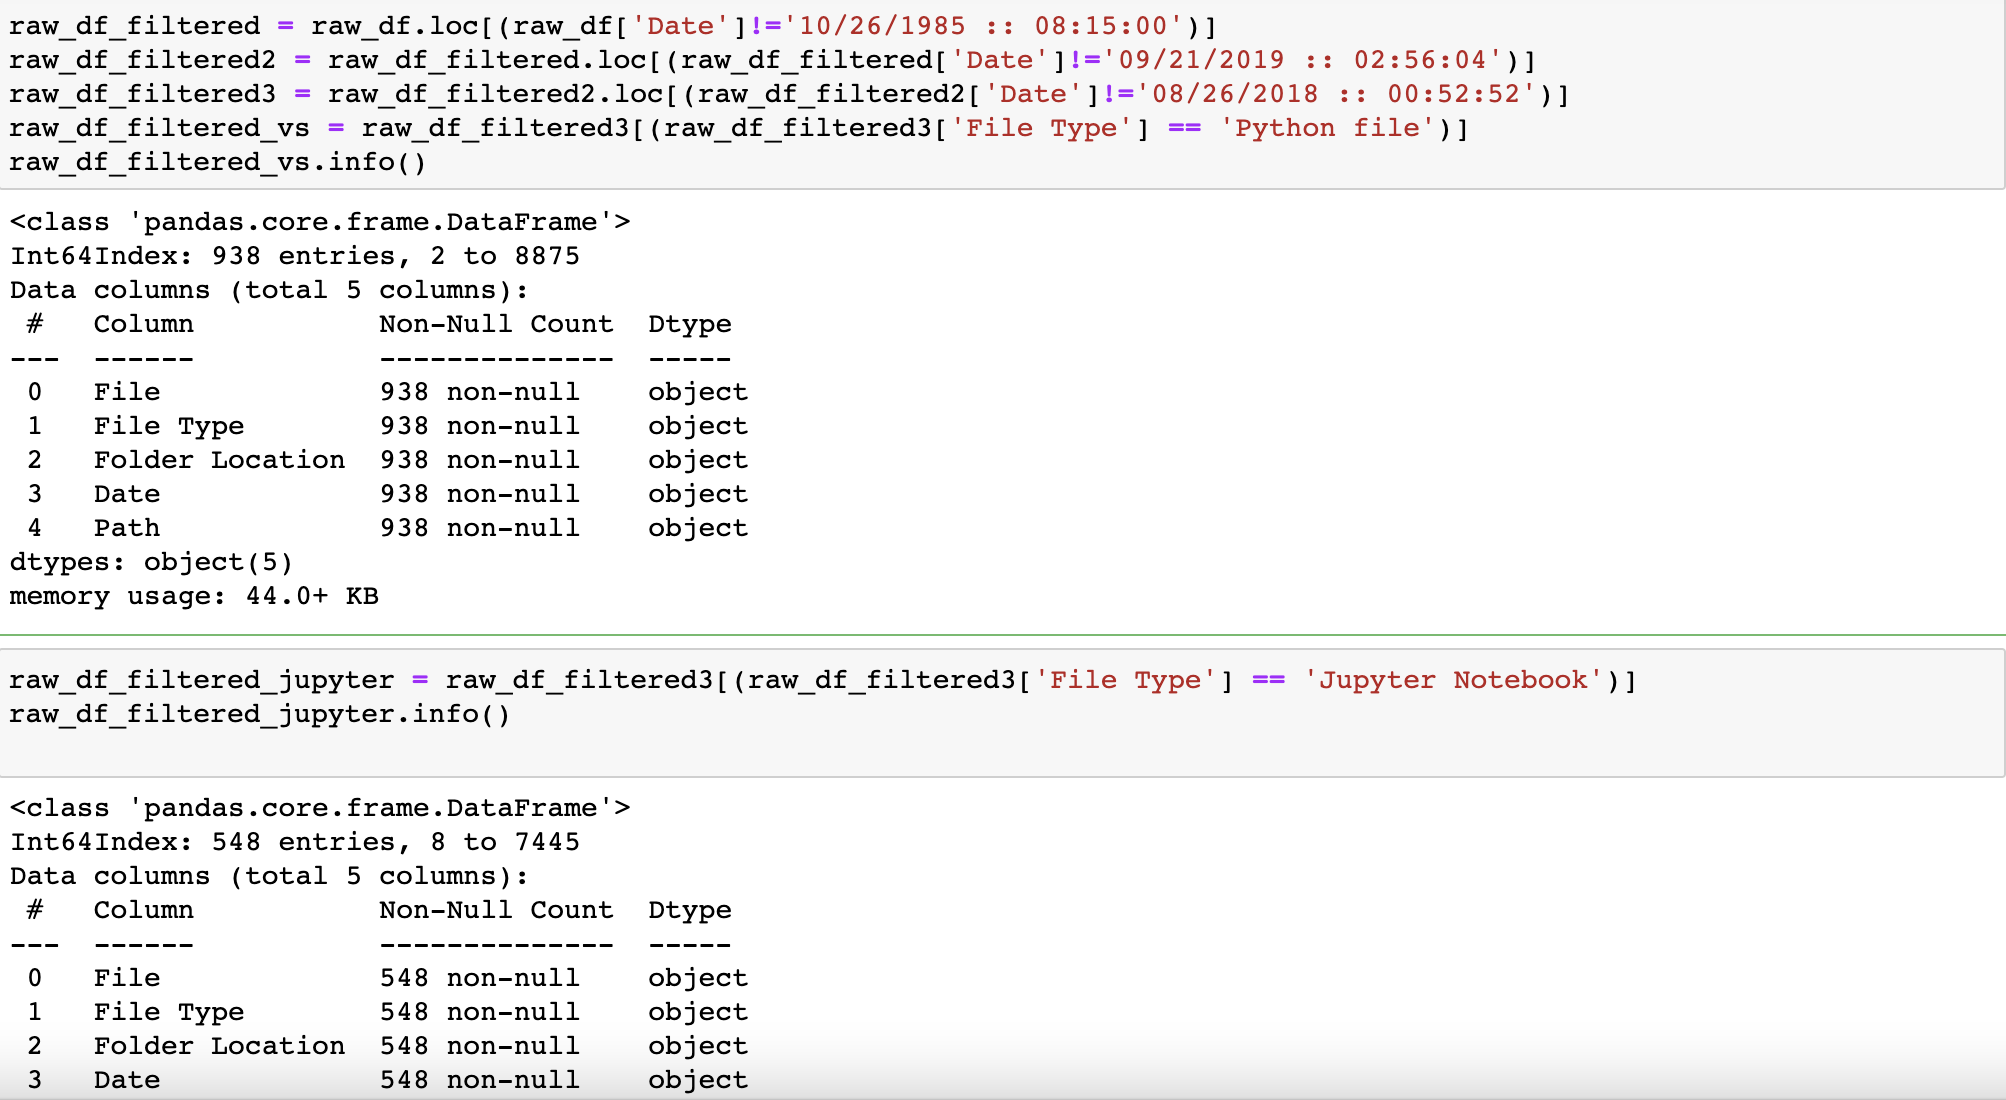
Refine the dataset by filtering outliers and subsetting for python files only
Finally, after removing outliers and subsetting for only python files, I am left with 938 ".py" files and 548 ".ipynb" files.
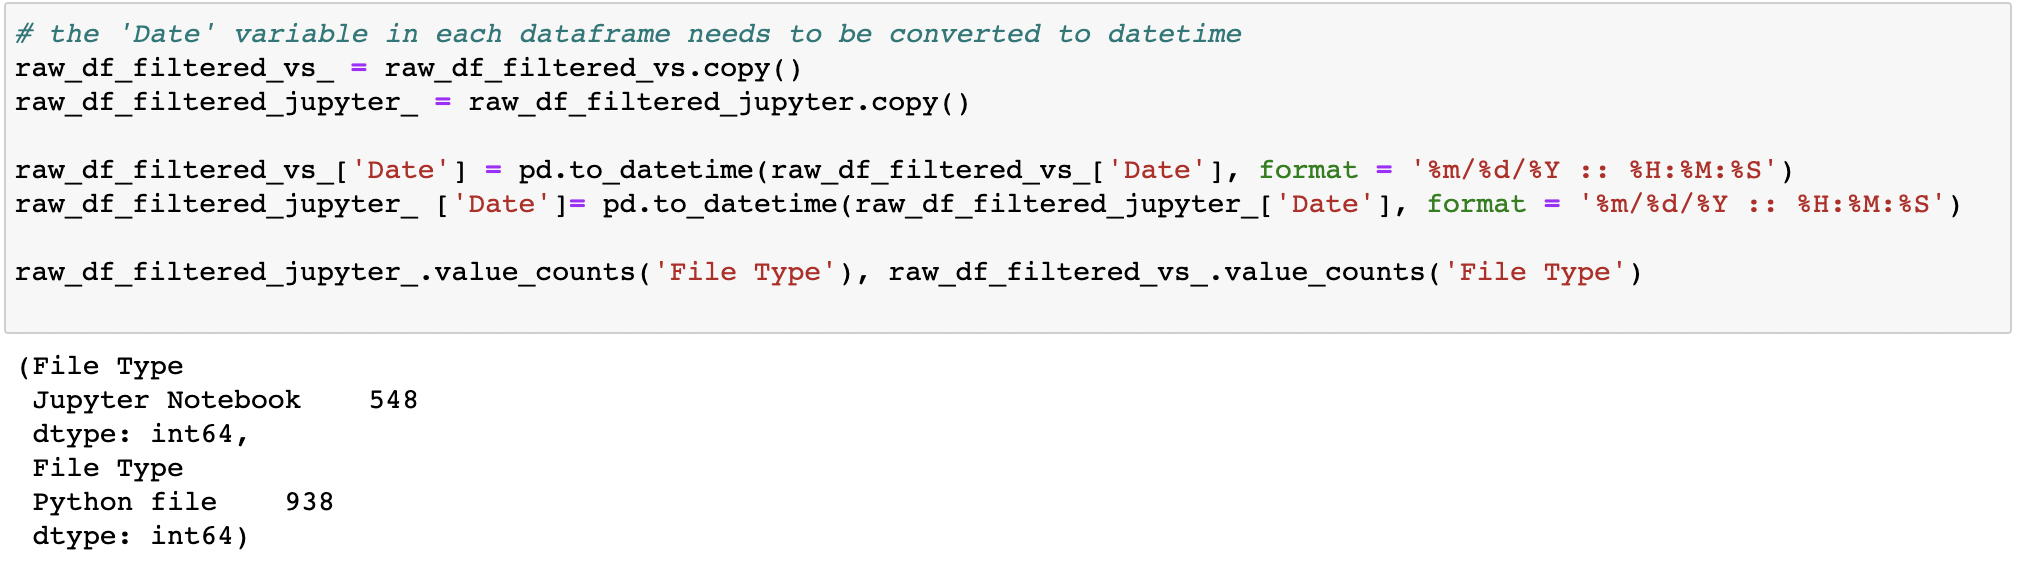
Now that the dataset is identified, in order to answer the data sets from a time-series analysis perspective, I need to change the data type of the 'Date' variable in order to allow for sorting. But first I further segment the dataset by creating specifc dataframes for each of Jupyter Notebook and Visual Studio. So I copy the dataframes and apply panda's 'to_datatime' function for the Date columns. Note that the file count remains consistent.
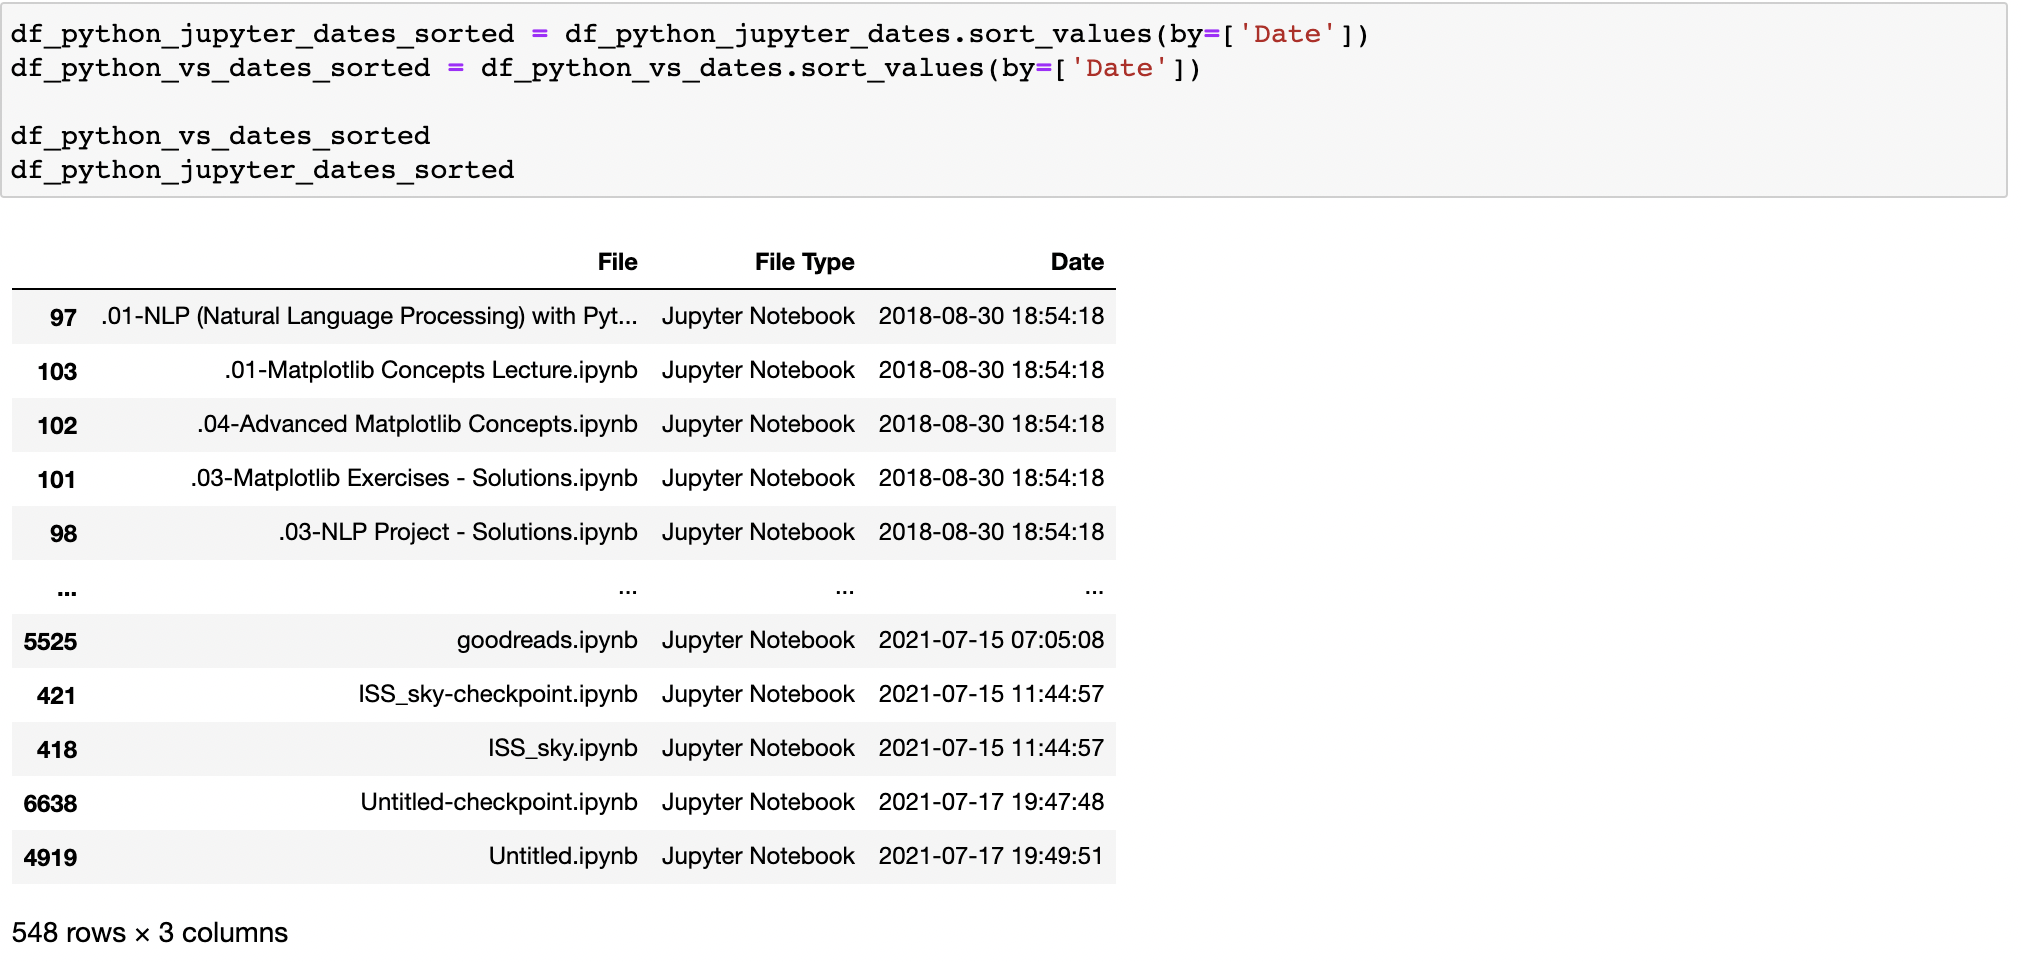
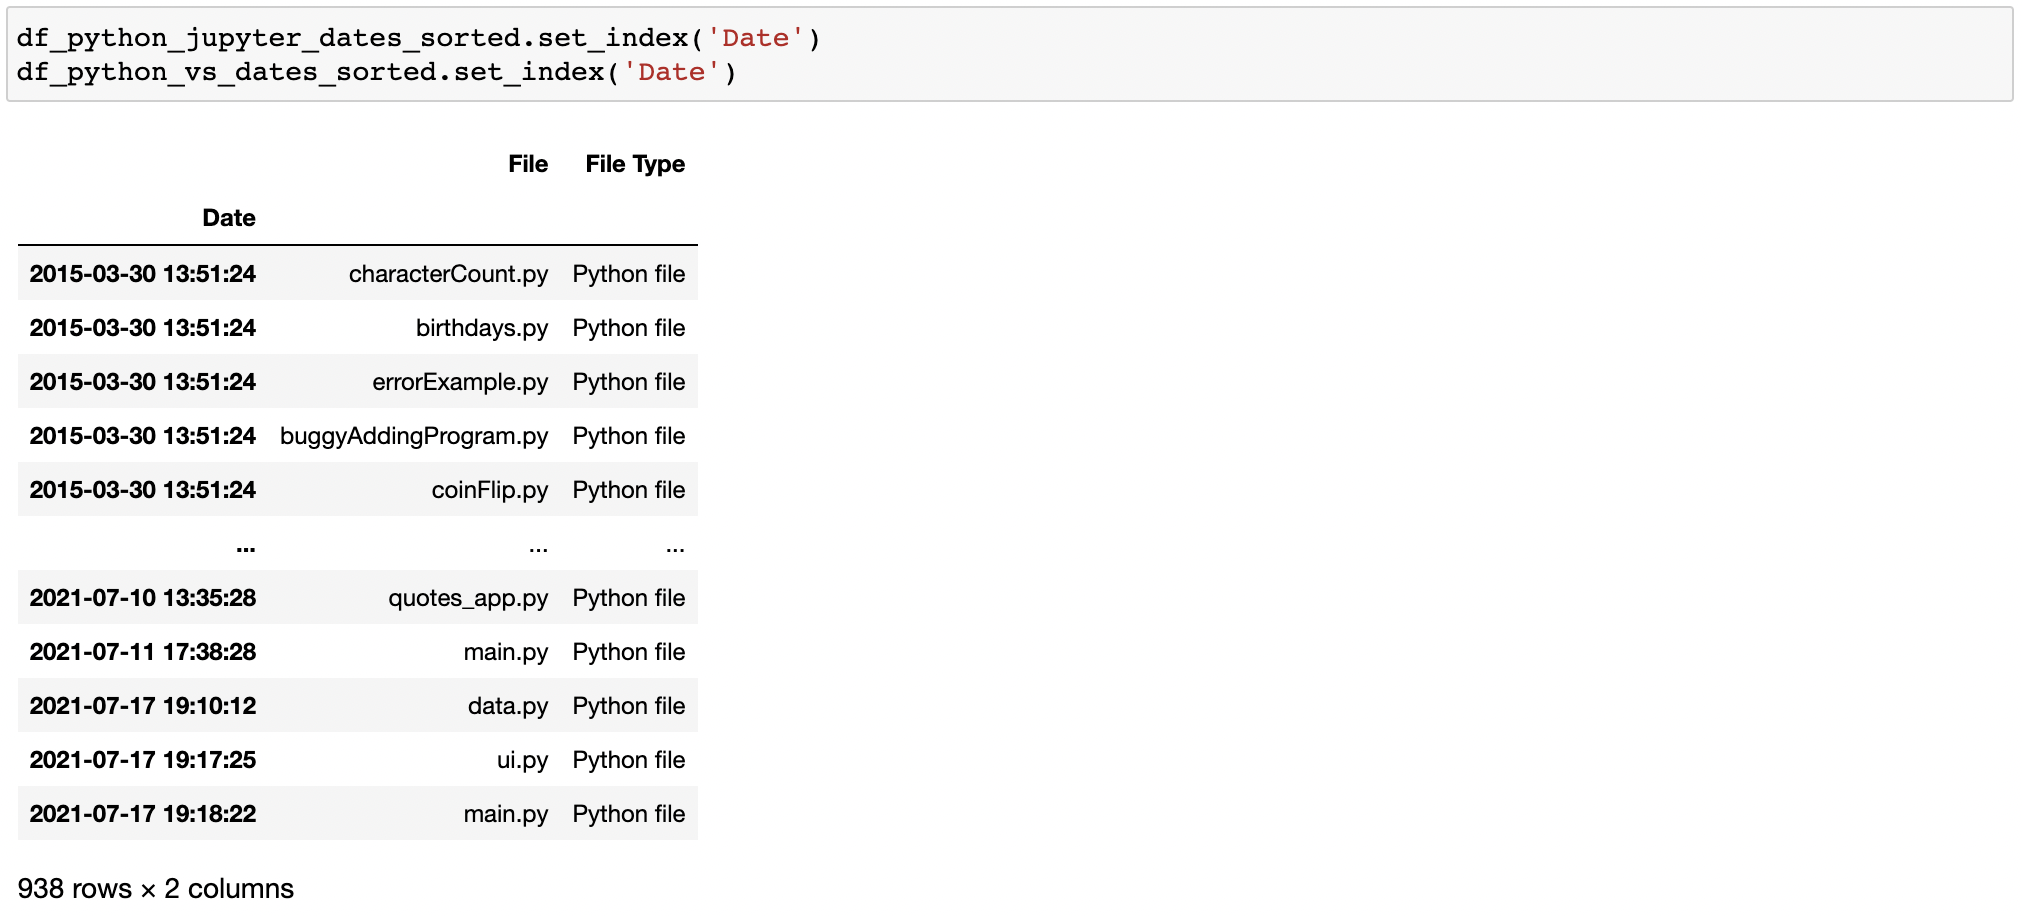
Now I subset the dataframe further so that it incldues only the variables 'File', 'File Type', and 'Date. Then for each dataframe, I use 'sort_values' to first sort by chronological order, then I change the dataframe index to the datetime column.
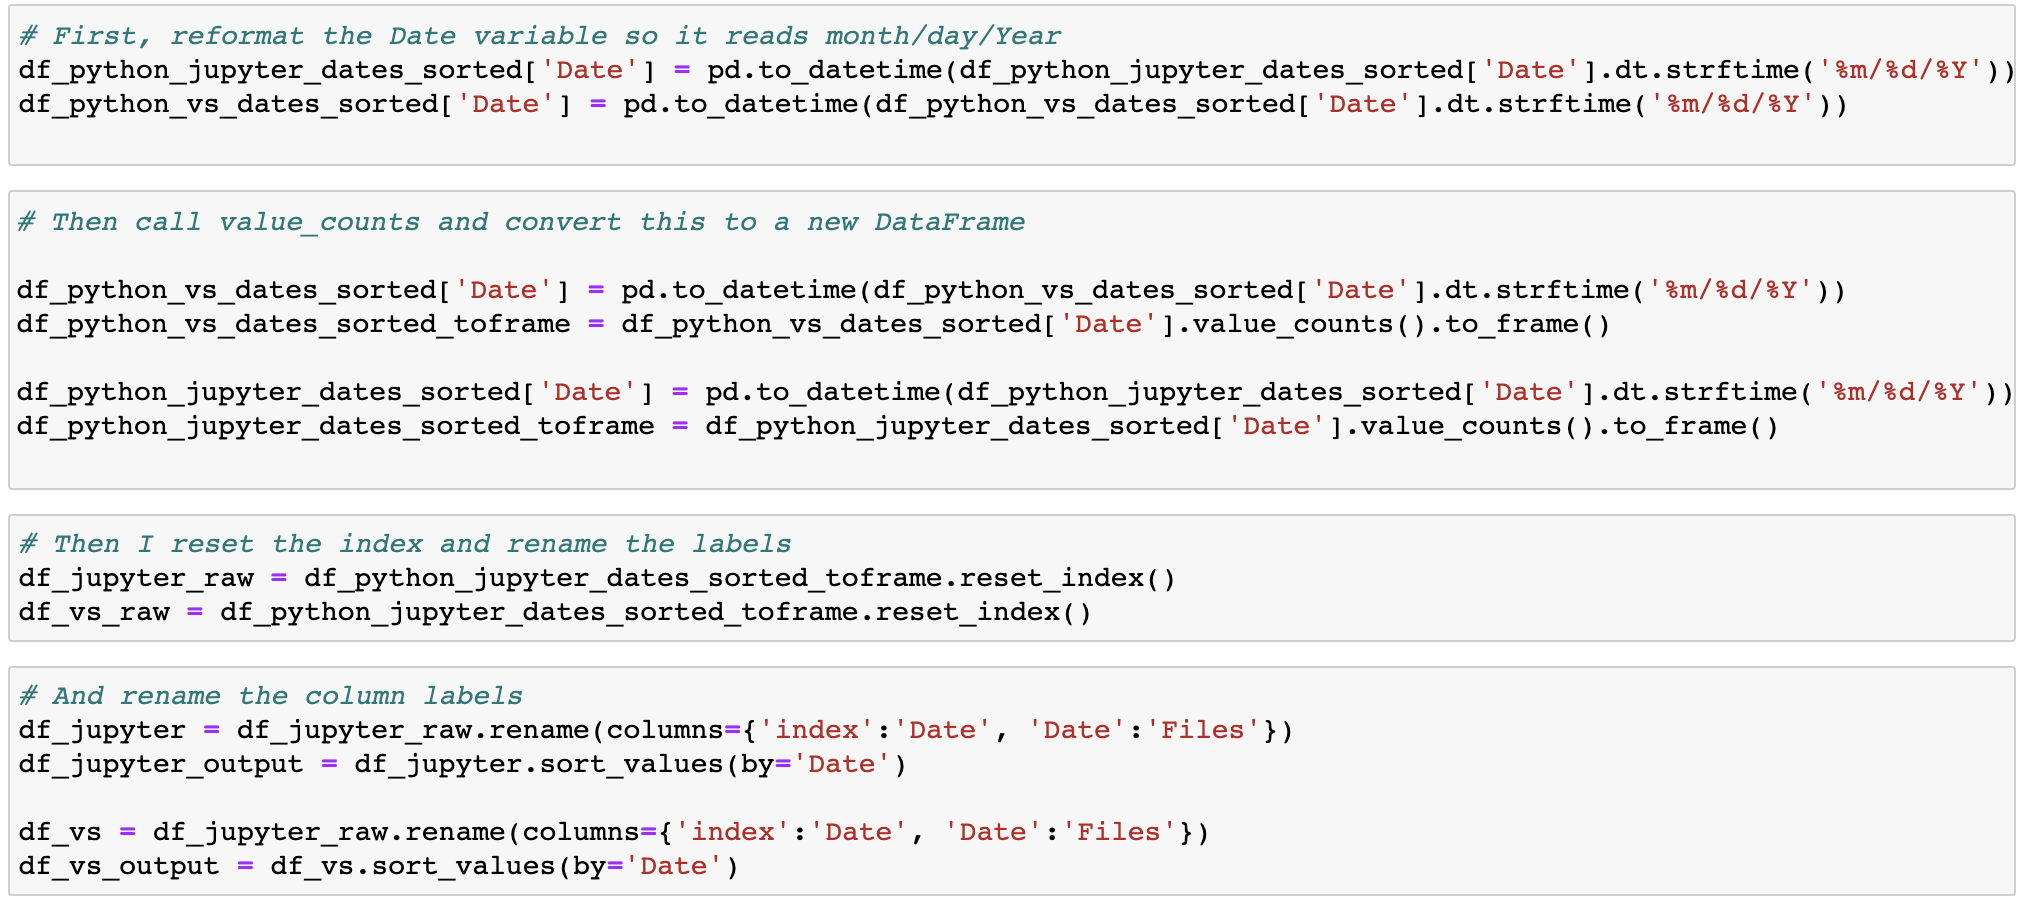
Then, I reformat the "Date" format to read in 'month/day/Year' format, and use value_counts again to find the # of files for each unique date, which I convert to a new dataframe. For each new dataframe, I also sort by date, and rename the labels for the data.
Finally, a preview of the data which will be used for visualization.
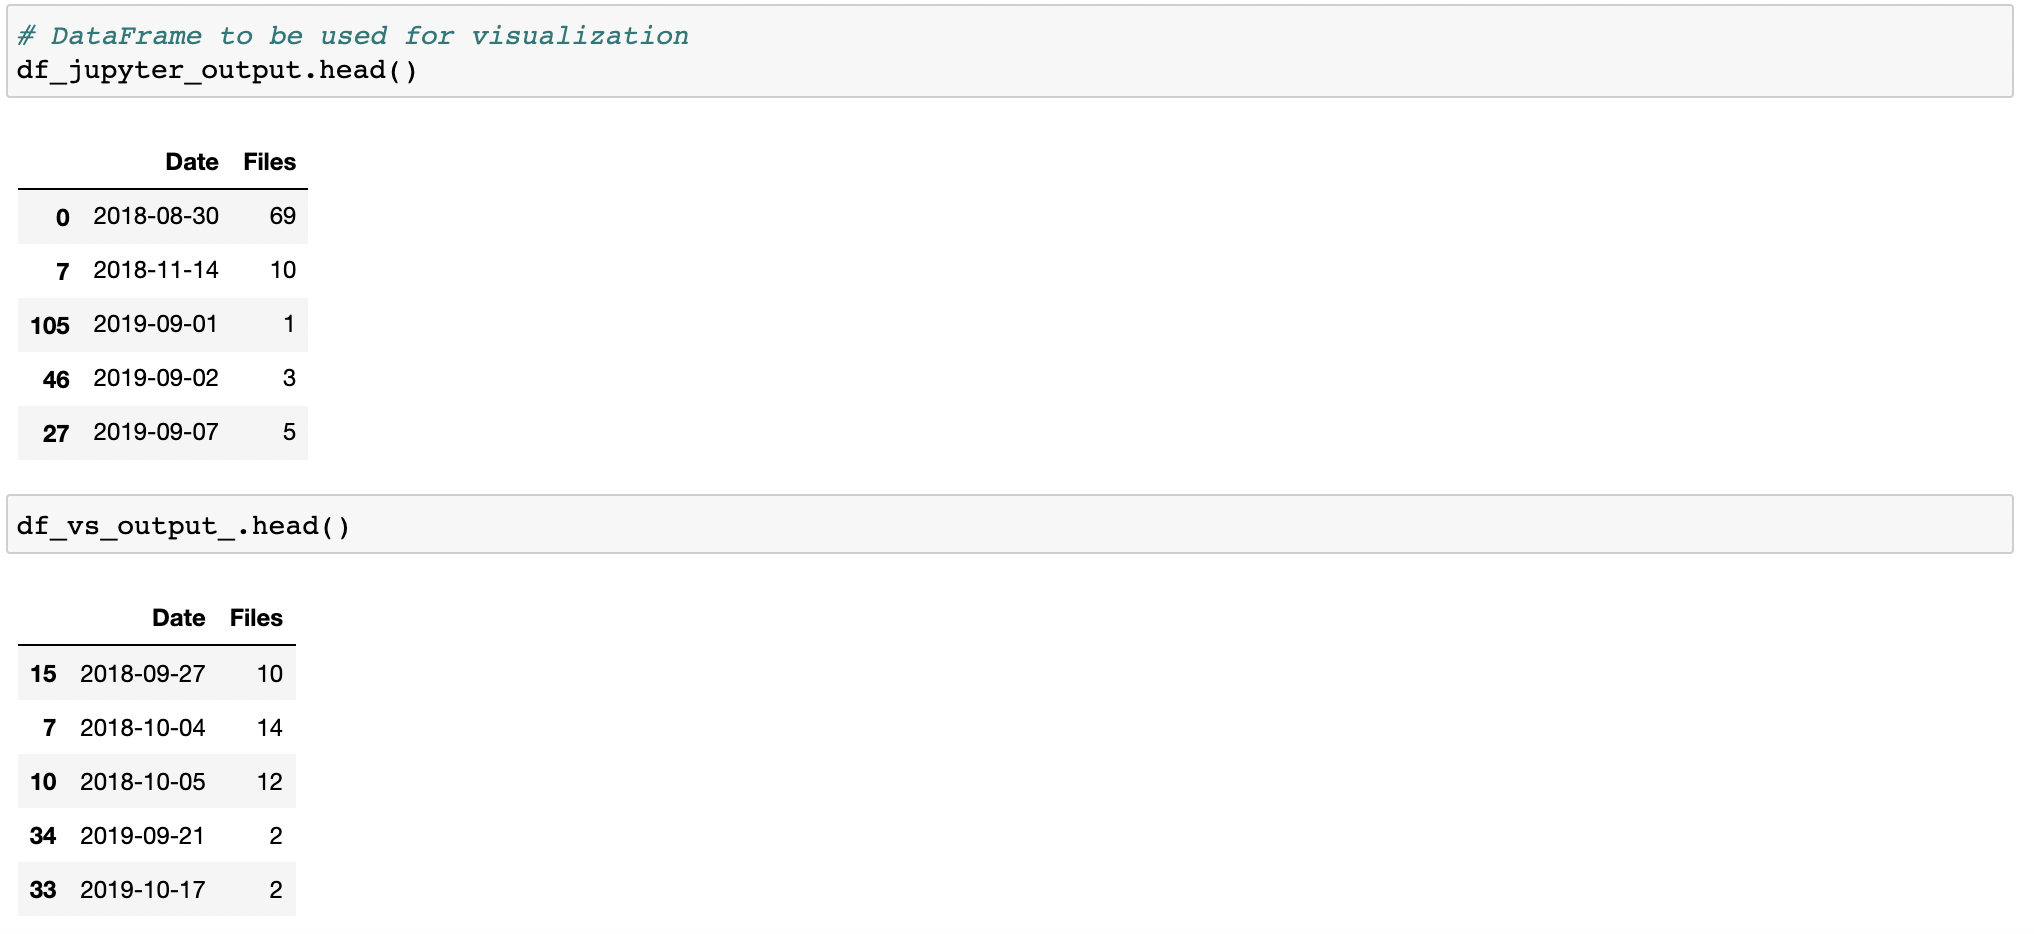
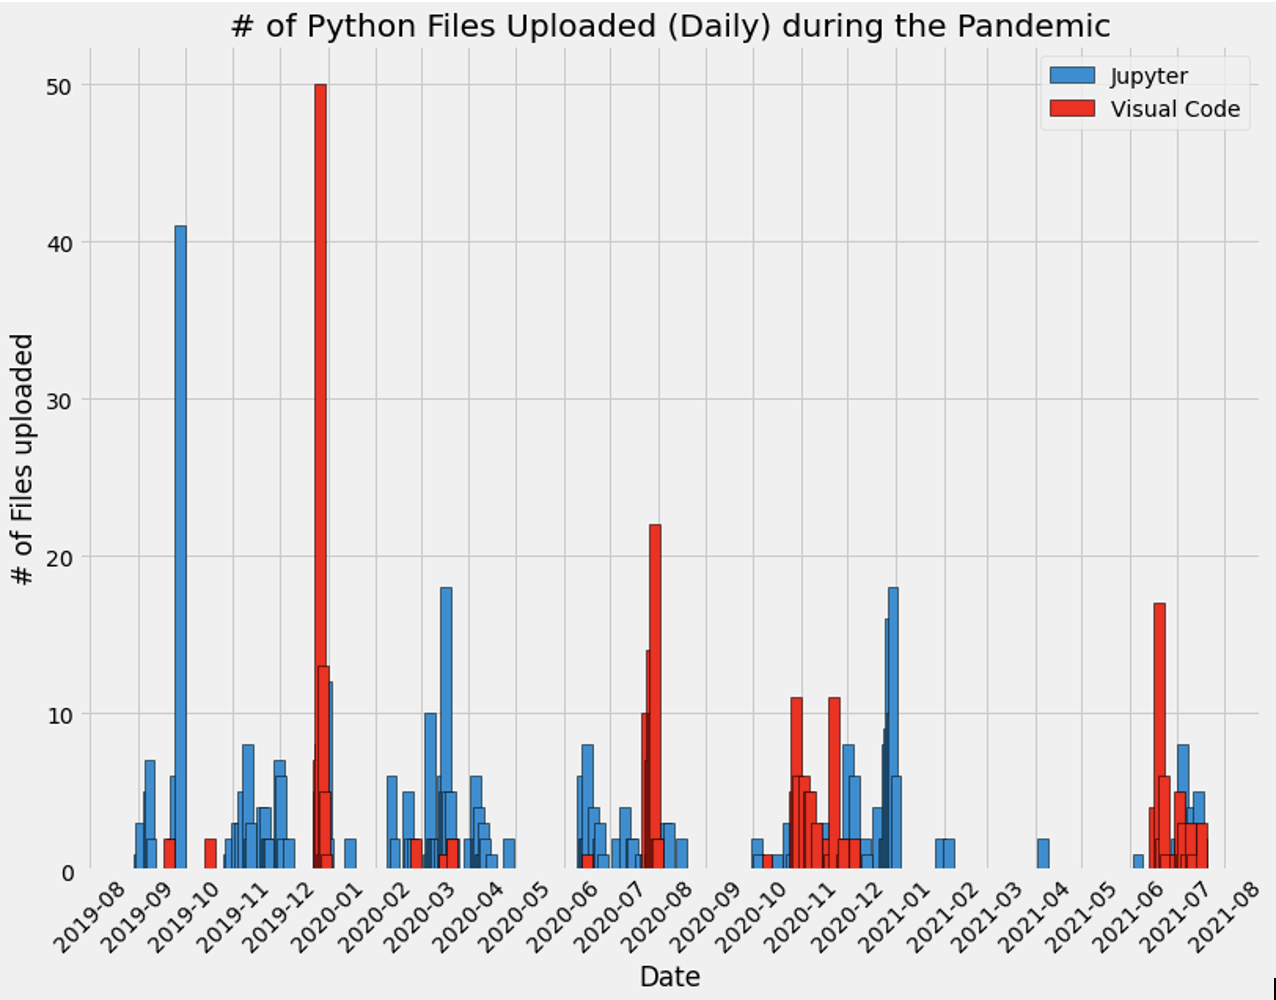
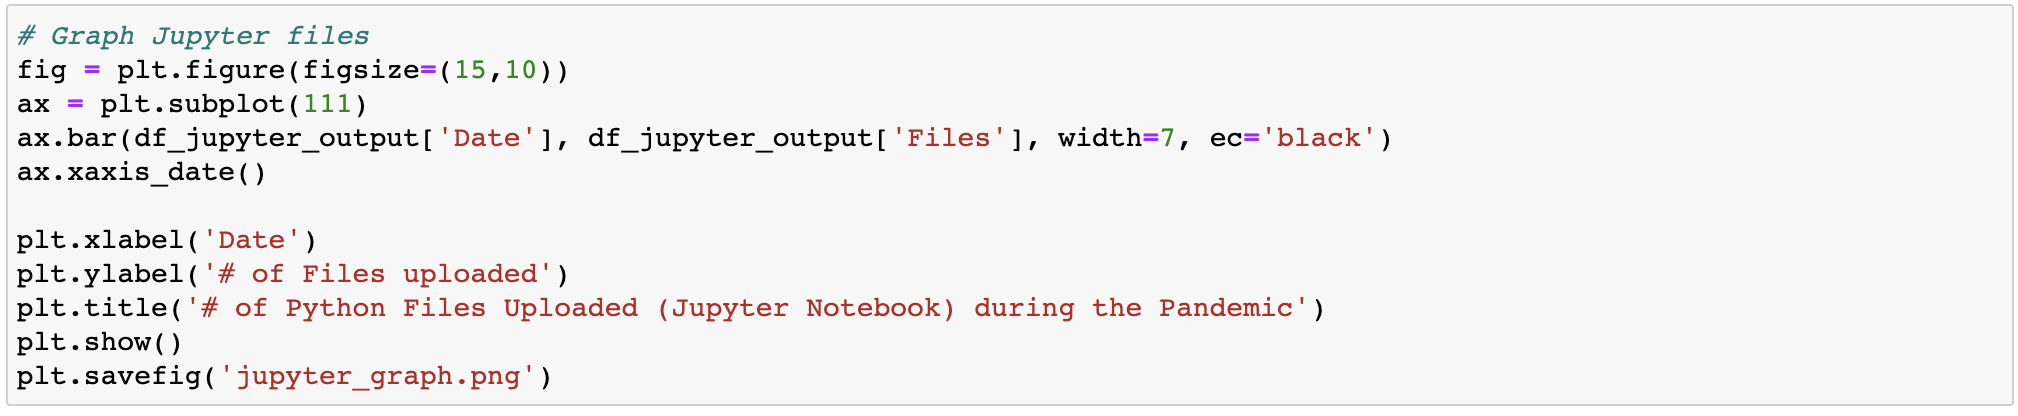
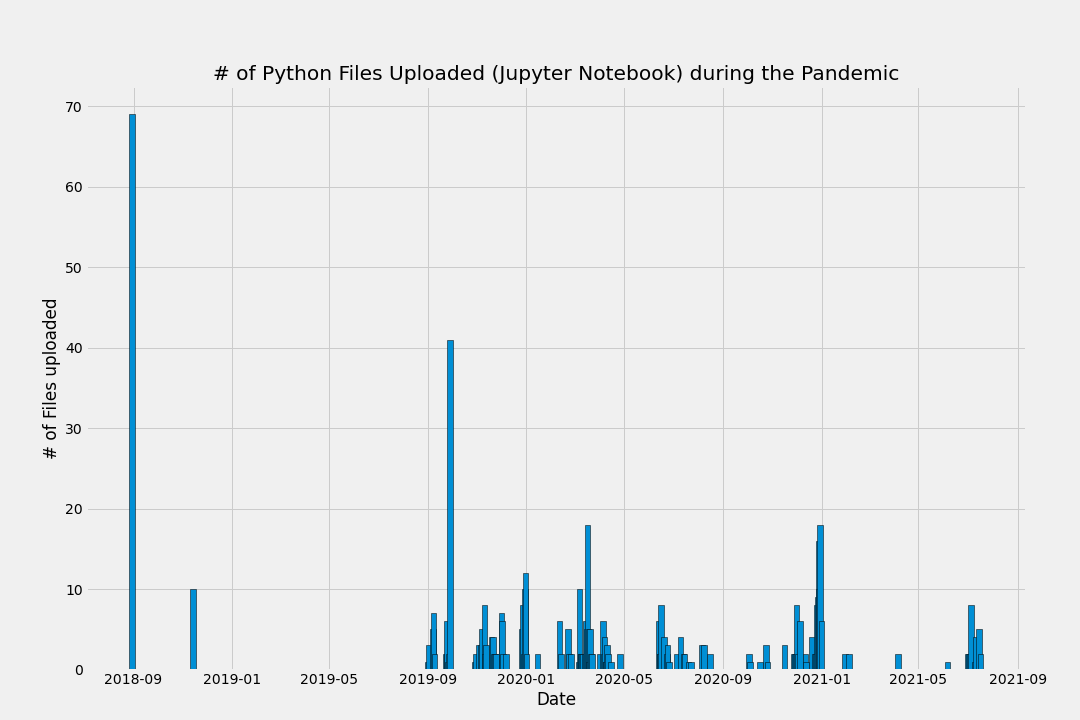
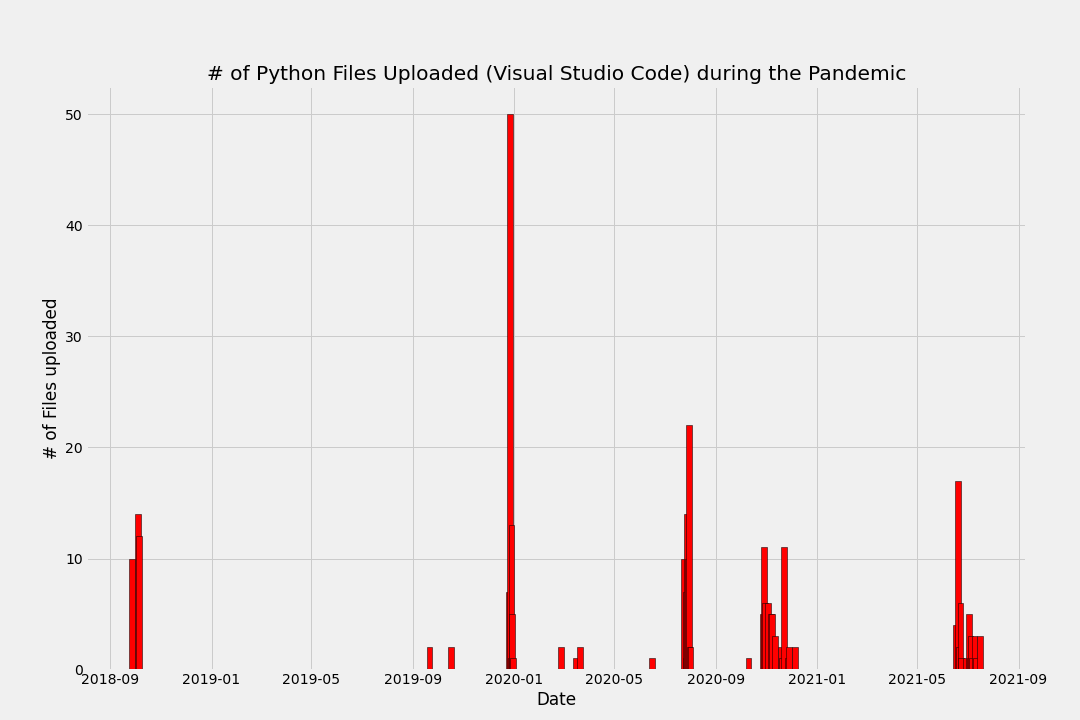
Finally, I plot each dataframe using matplotlib. See below for initial visualizations.
Visualizing the data - a first look
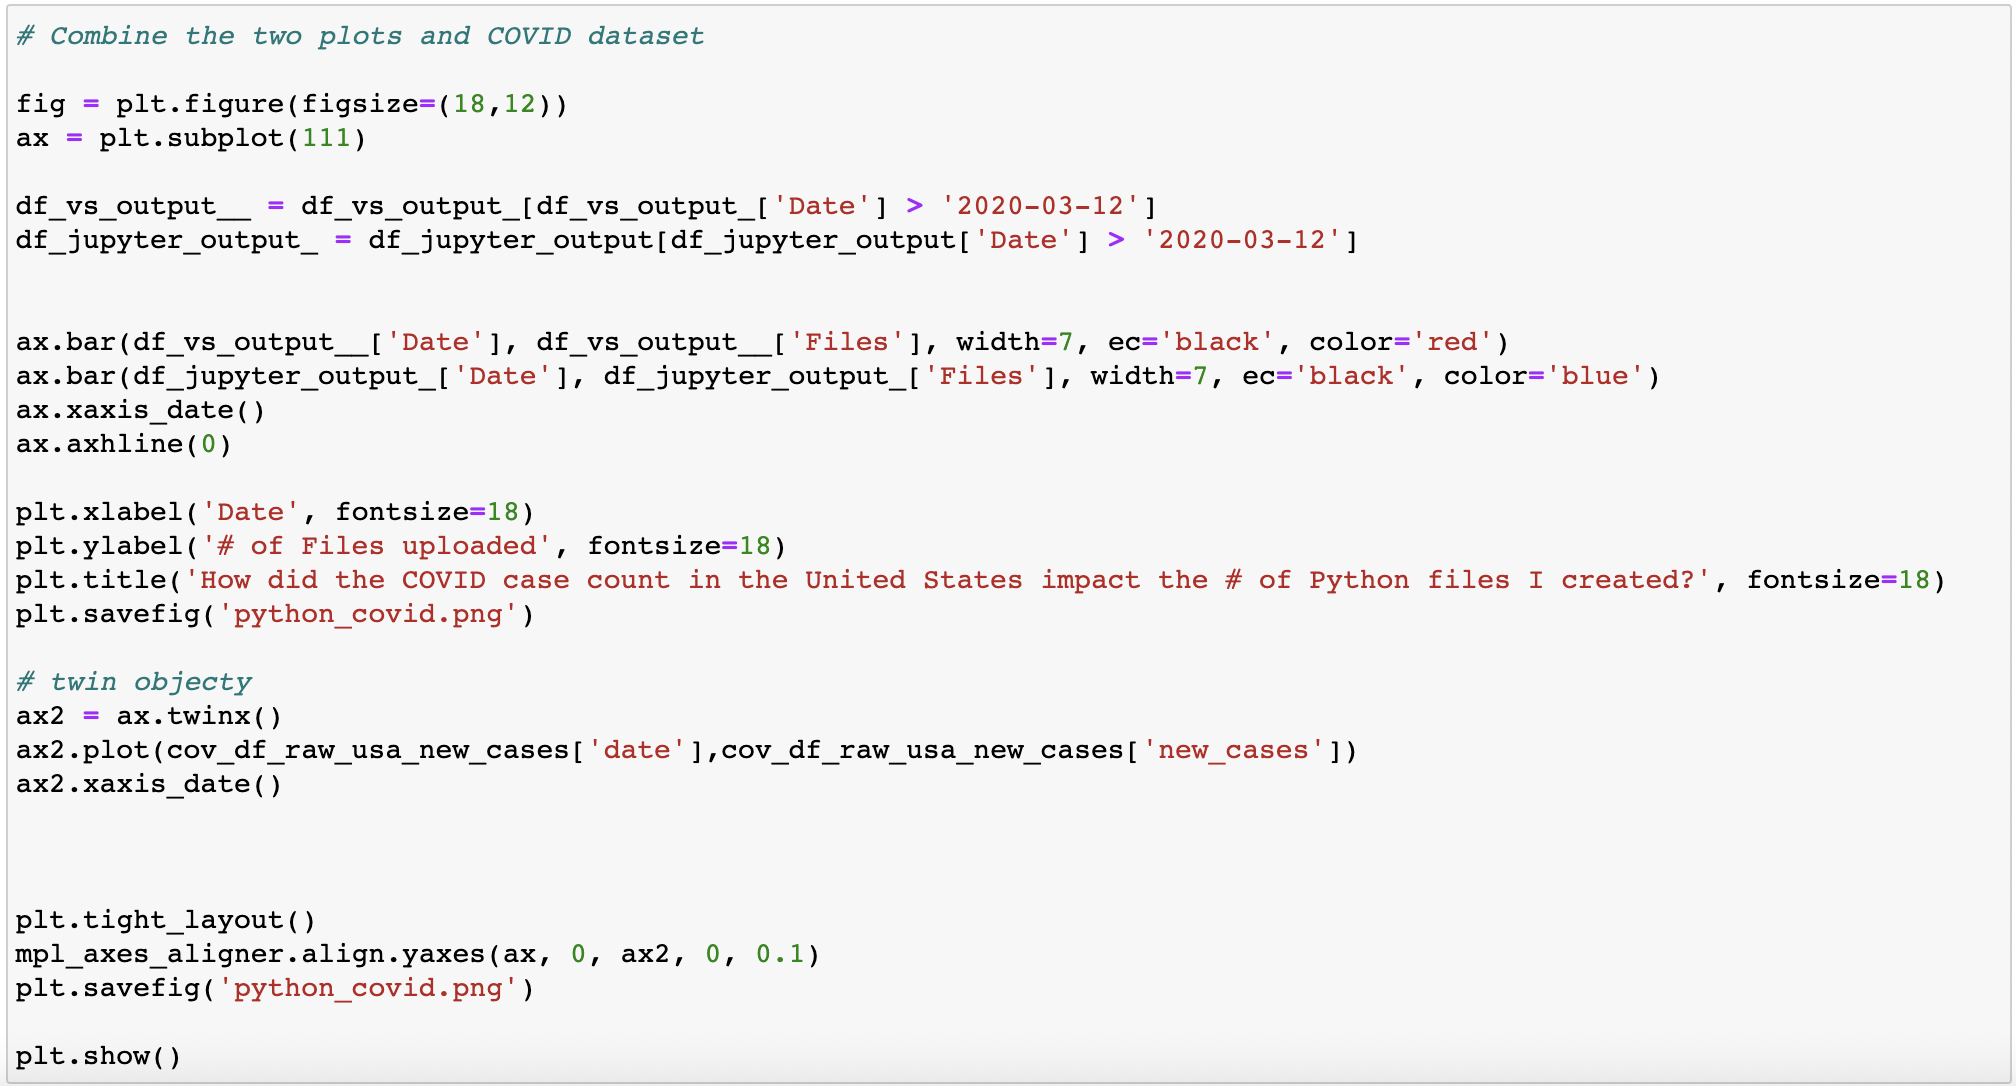
Now combine both plots together:
How many python files did I upload pre-COVID (3/12/2020), and during the pandemic?
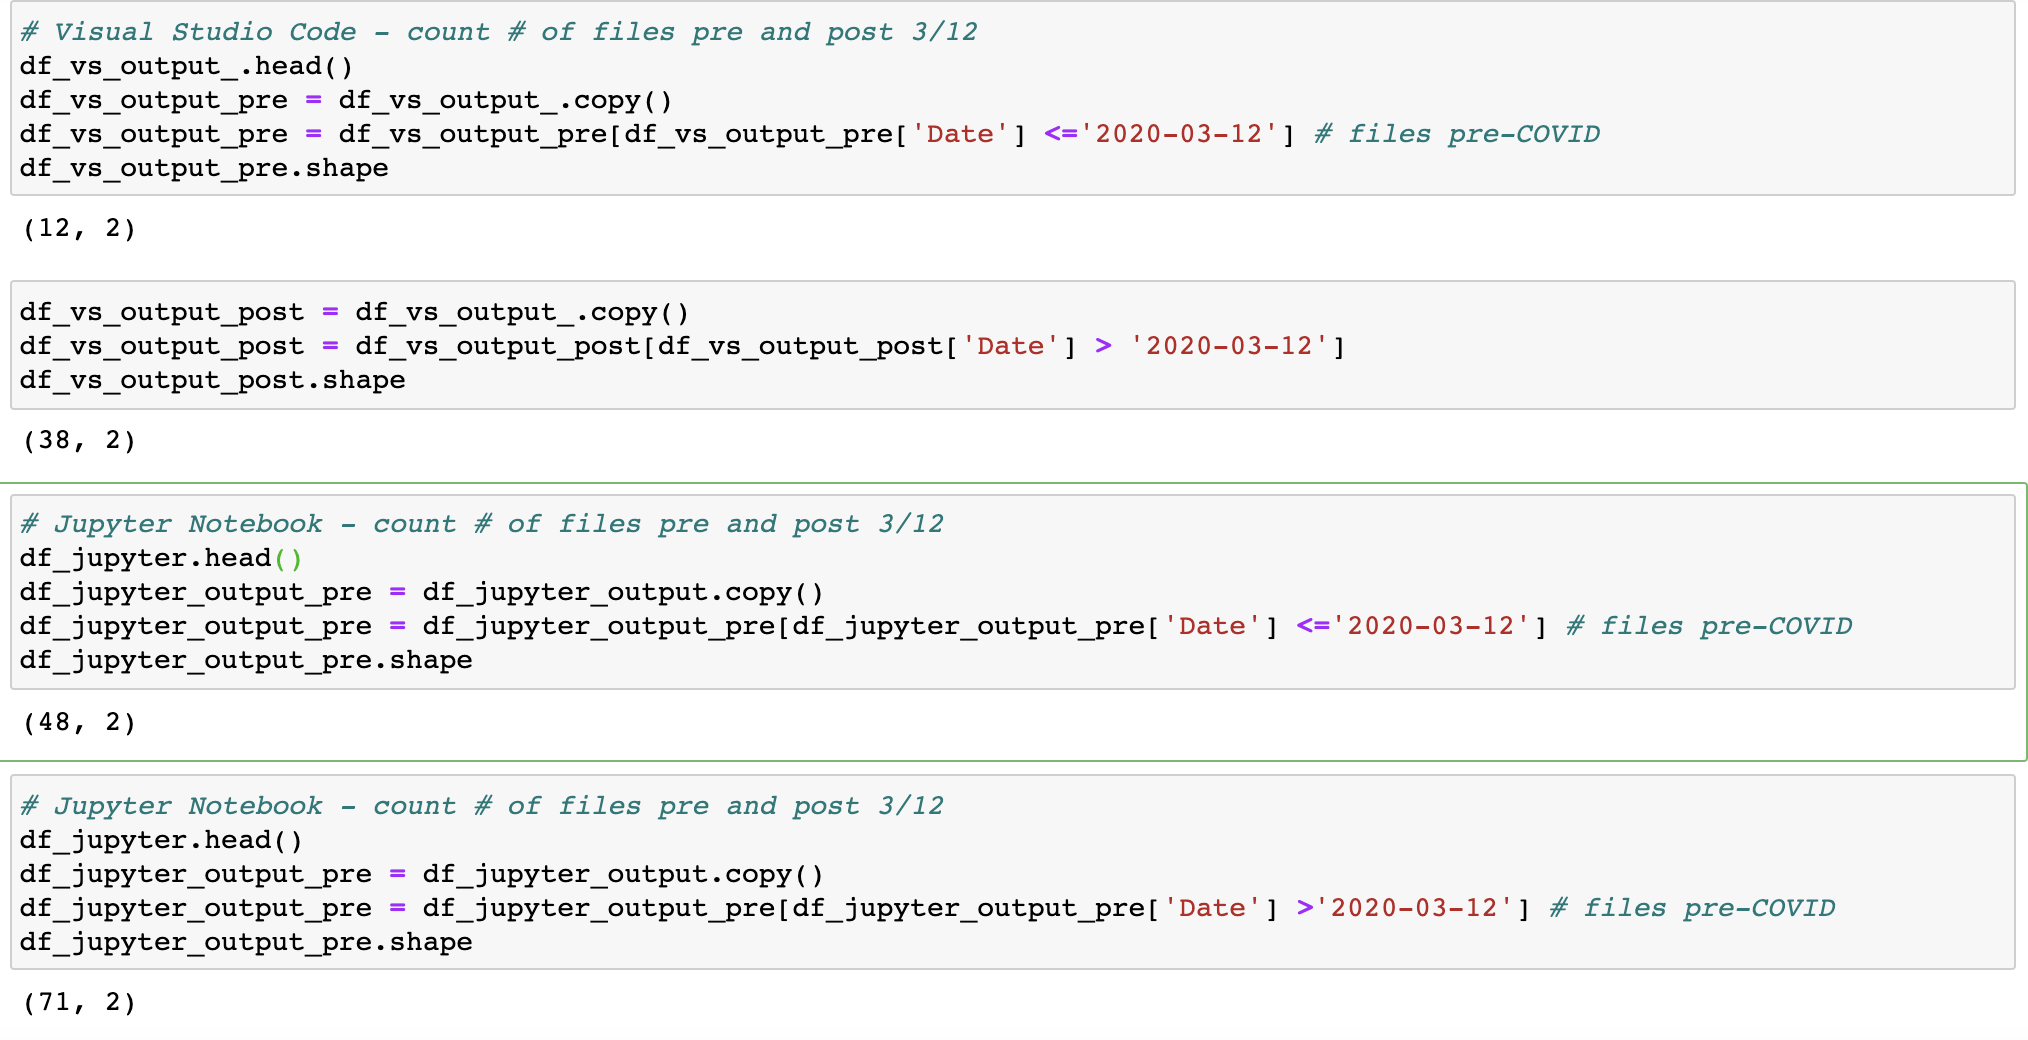
With the dataset identified, now the analysis can start. First, I start by sorting each dataset by date. I use 3/12/2020 as the threshhold for the onset of the pandemic. The code below shows conditional dataframe subsetting, and the '.shape' function counts the unique dates on which python files were uploaded. So the output shows that I saved and updated files featuring Visual Studio Code programming files on 12 unique days prior to 3/12/2020 and 38 unique days after this date; while I uploaded files using Jupyter Notebook on 48 days prior to 3/12/2020 and 71 unique days after 3/12/2020.
Next, I need to sum the # of files for each of the 4 dataframes I have subsetted (1 each for pre- and post- 3/12/2020, for Jupyter Notebook and VS Code). Below I show the result:
Now, I am really curious to know if there was a correlated effect of coronavirus cases and # of python files uploaded -- so now I introduce a new data set
Overlay of coronavirus data
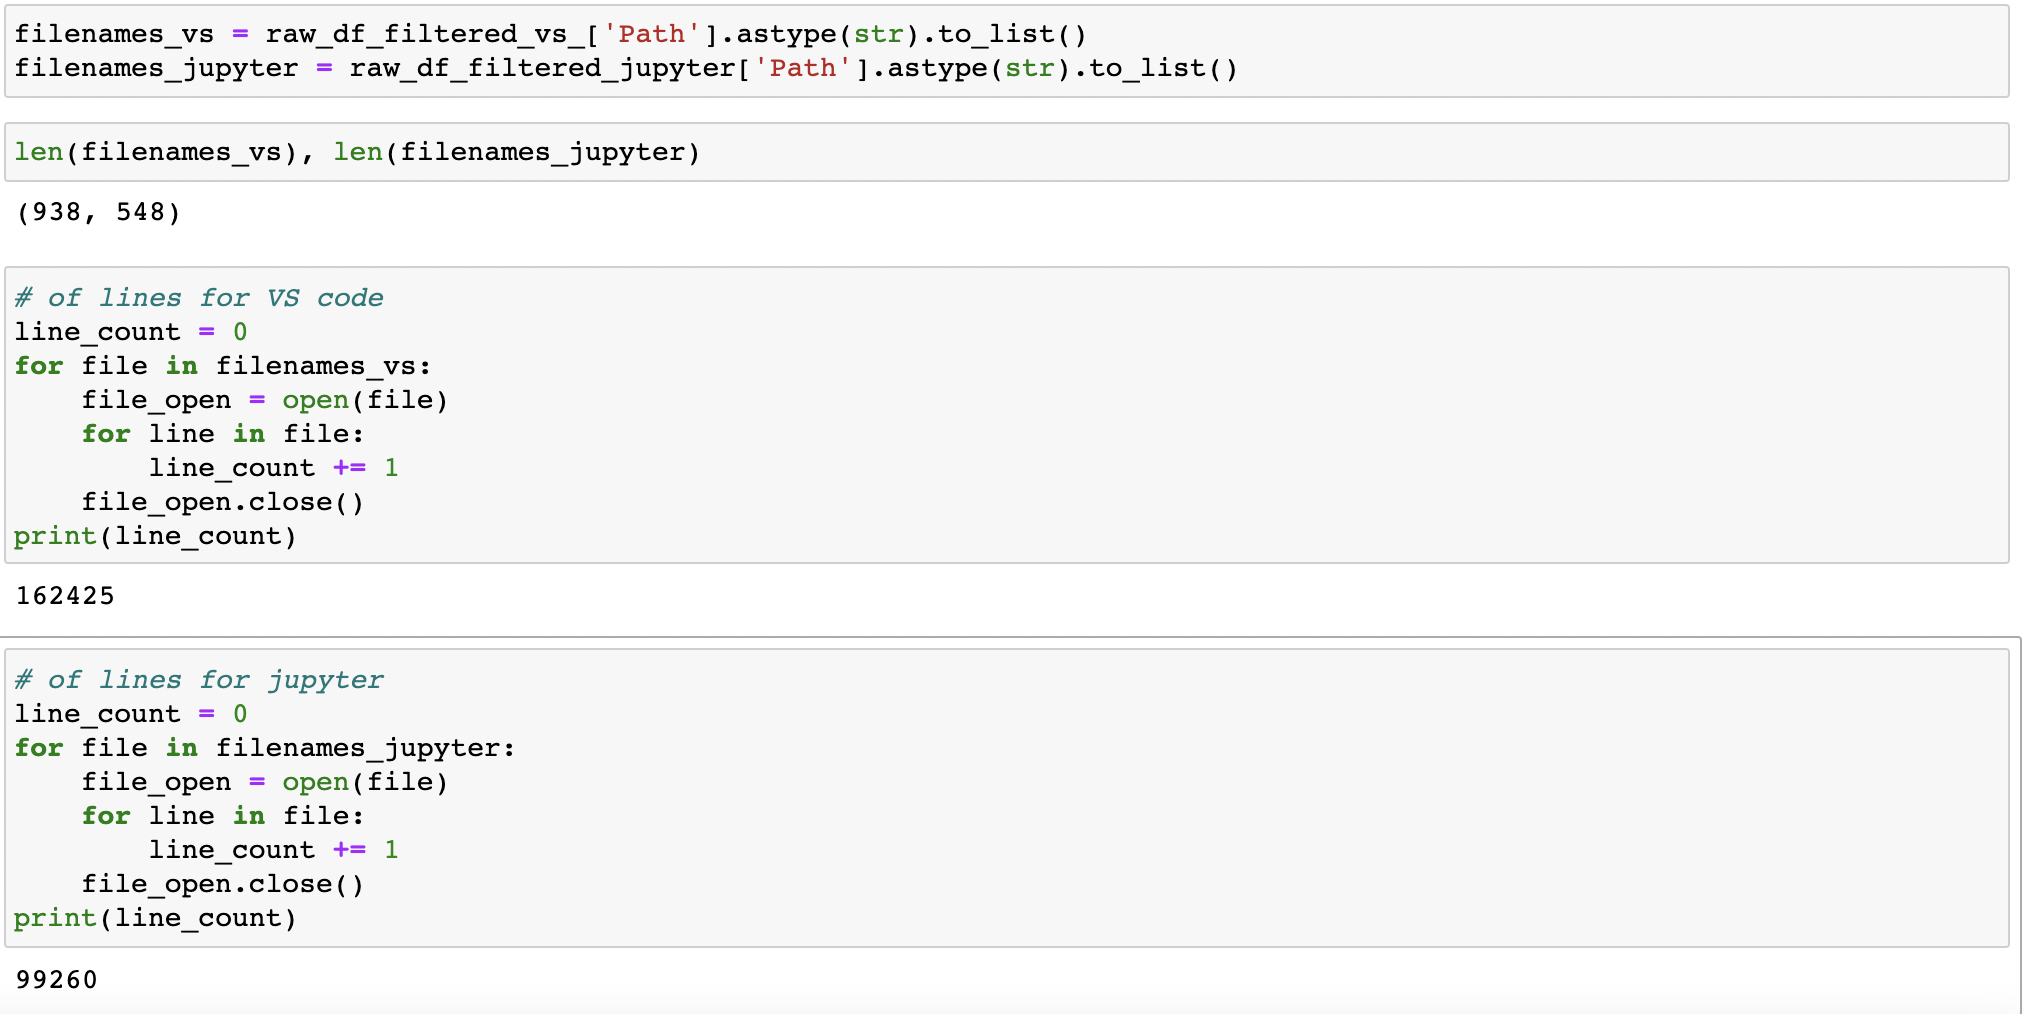
How many lines of code total?
The preliminary answer is: 99,260 lines of python code across Jupyter Notebook files (an average of ~181 lines of code per file); and 162,425 lines of code across VS Code files (an average of 297 lines of code per file). See below:
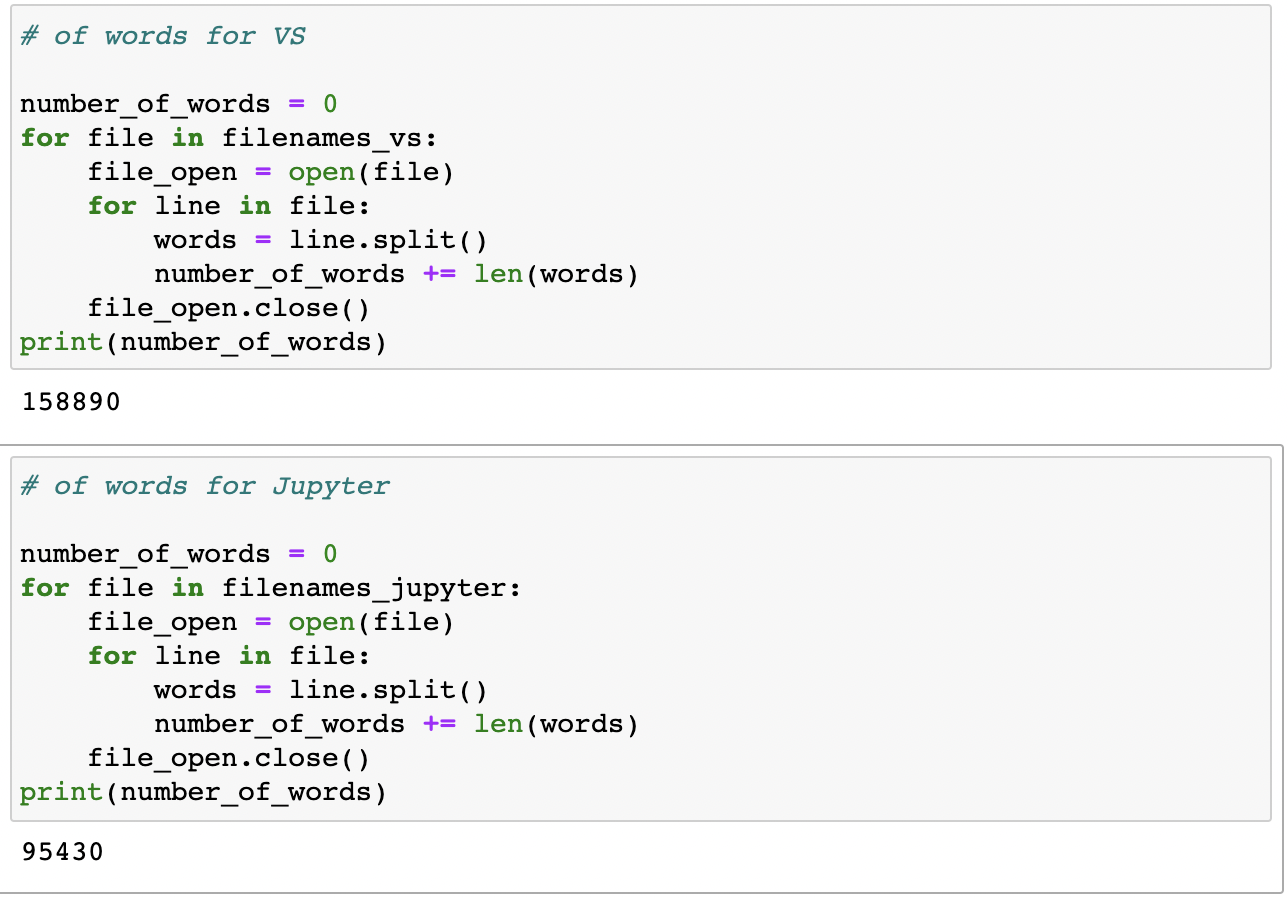
How many words did I write?
The preliminary answer is: 95,430 words across Jupyter Notebook files (an average of ~174 words per file); and 158,890 words across VS Code files (coincidentally, an average of ~173 words per file). Note the difference in words and line per file across Jupyter Notebook and VS Code, which can be explained by the differences in formatting and interface between the files. Jupyter Notebook only counts executed cells as a line, while VS Code, lines are often skipped for formatting purposes and to make the code easier to read. See below:
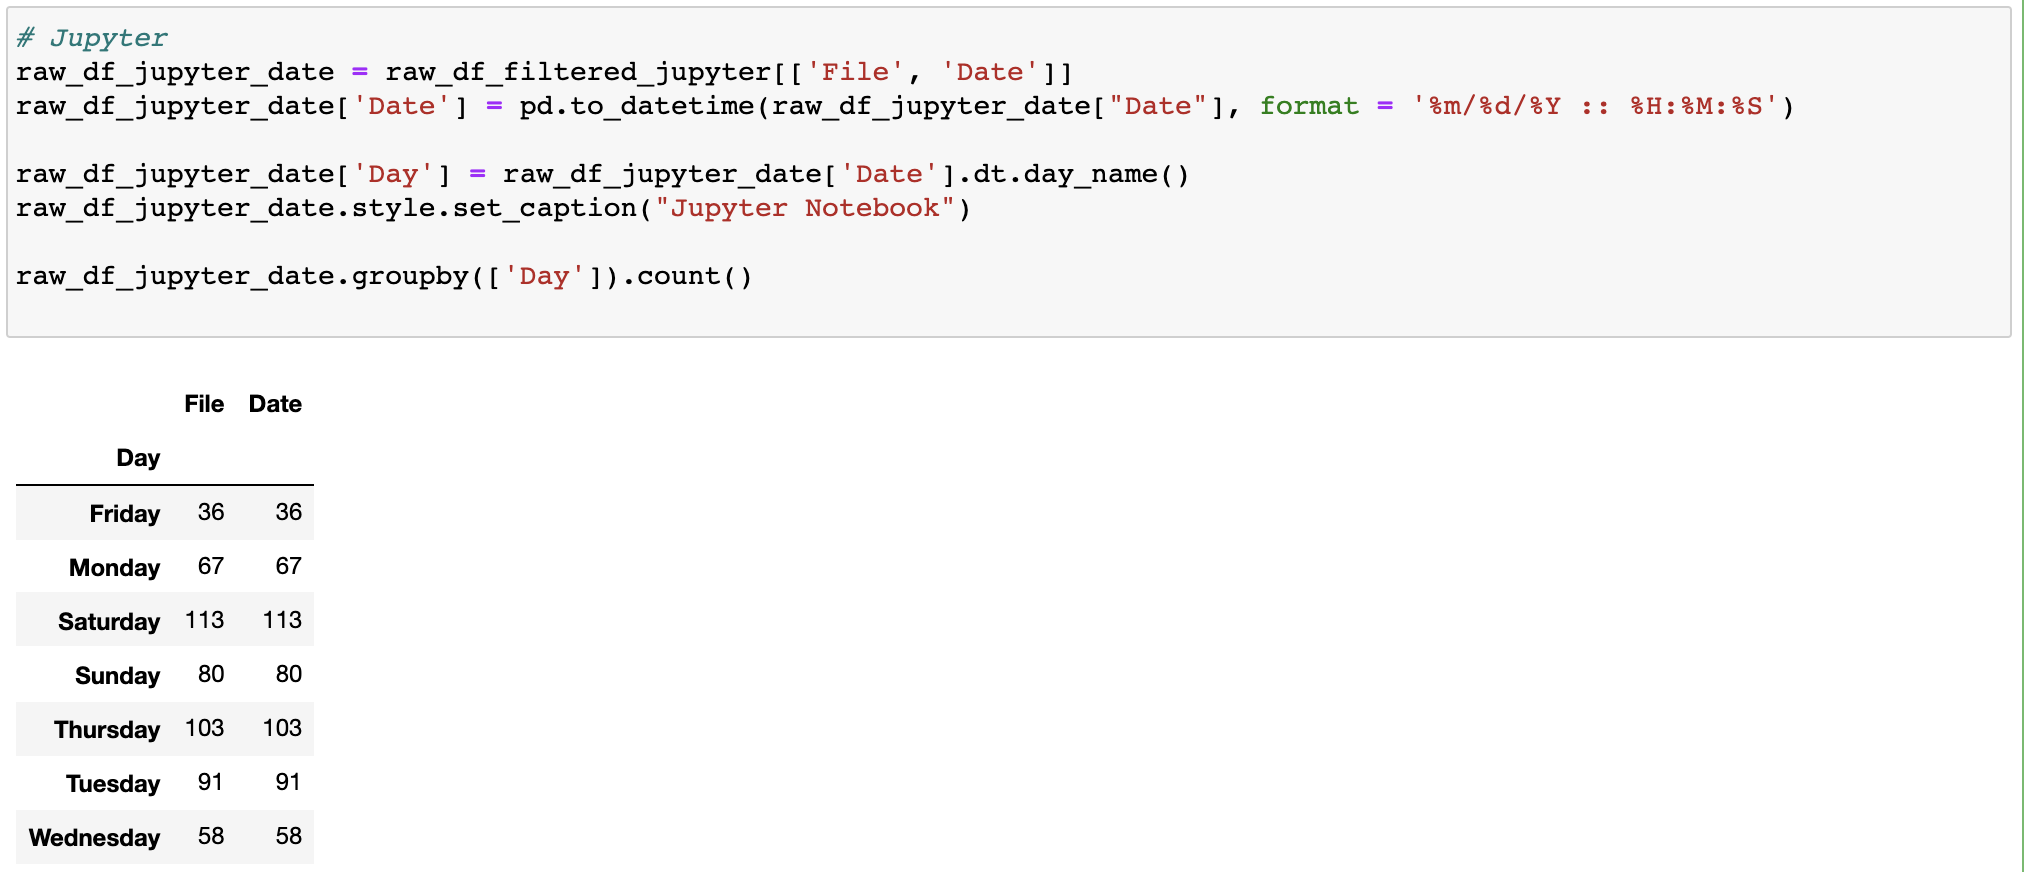
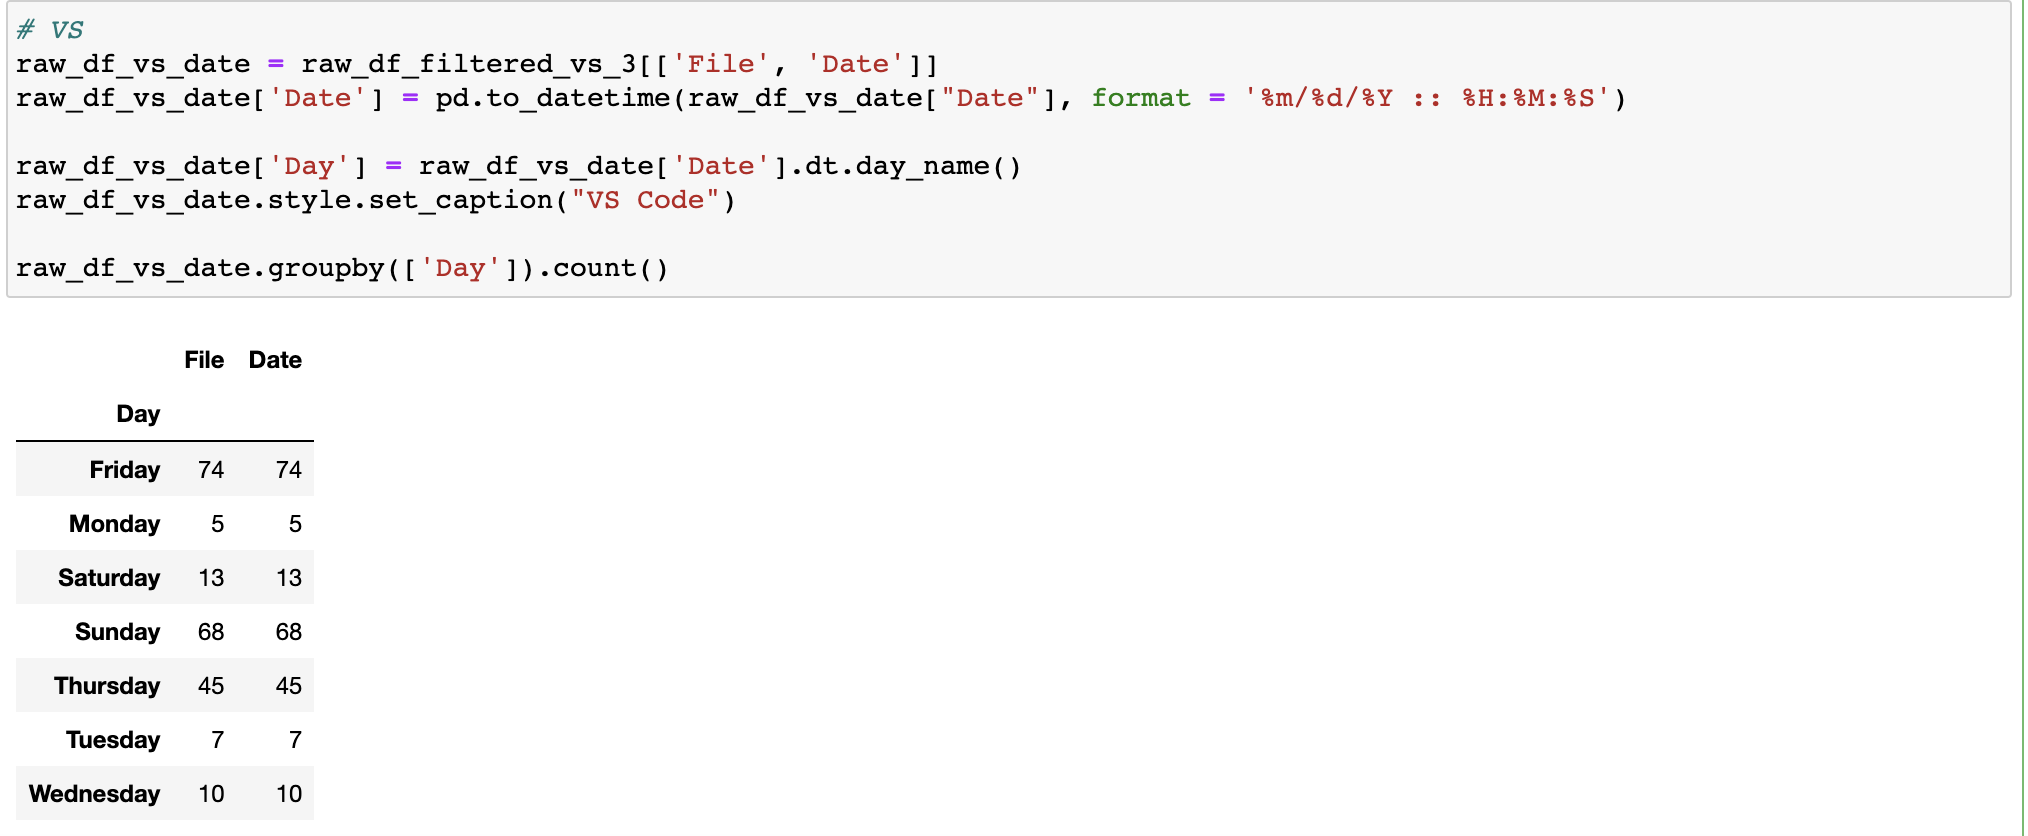
What days and times of day was I most active?
I was a weekend warrior.